
Netflix Replica DevSecOps Project: Comprehensive CI/CD Pipeline Guide
Using AWS Cloud with EC2 Instances
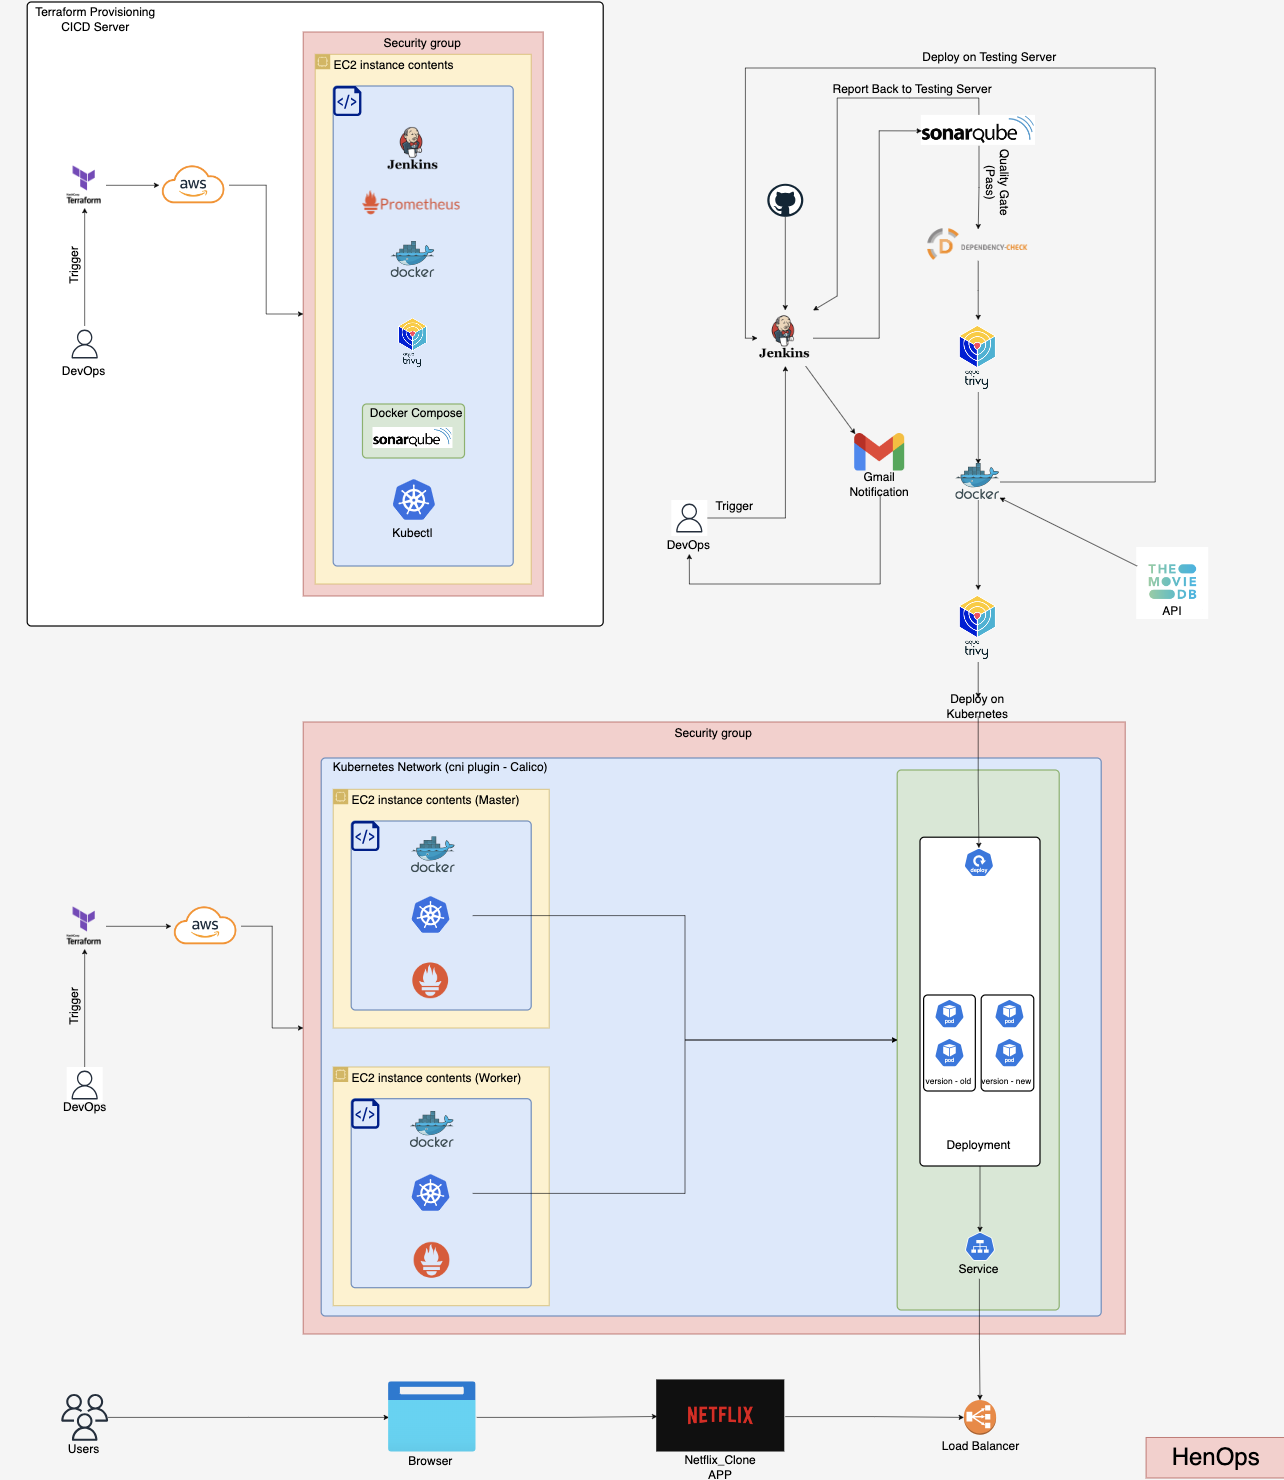
Using Jenkins on AWS Cloud with Azure Kubernetes Service

Tools and Technologies for Netflix Replica DevSecOps Project
Our Netflix Replica project utilizes a comprehensive set of tools and technologies to ensure efficient development, robust security, and seamless deployment. Here's an overview of our tech stack:
Infrastructure and Cloud Services
- Terraform: For Infrastructure as Code, enabling consistent and version-controlled infrastructure management
- AWS and Azure: Leveraging multiple cloud providers for flexibility and redundancy
Container Orchestration and Management
- Kubernetes (K8s): For efficient container orchestration and scaling
- Docker and Docker Compose: For containerization and local development environments
- Kubectl: For Kubernetes cluster management and deployment
Continuous Integration and Delivery
- Jenkins: Powering our CI/CD pipeline for automated building, testing, and deployment
- Java (OpenJDK 17): Our primary programming language for backend services
Security and Code Quality
- Trivy: For comprehensive vulnerability scanning of our containers and artifacts
- SonarQube: Ensuring code quality and identifying potential issues early in development
Monitoring and Observability
- Grafana: For creating insightful dashboards and visualizations
- Prometheus: Collecting and storing metrics for analysis and alerting
External Services
- TMDB API (The Movie Database API): Providing up-to-date content data for our streaming service
This carefully selected stack enables us to build a scalable, secure, and high-performance Netflix Replica while maintaining best practices in DevSecOps.
Project Overview
This project showcases a comprehensive CI/CD pipeline for a Netflix clone. It outlines the steps for setting up the development environment, configuring essential tools, and implementing robust security and monitoring solutions.
NOTE: For advanced users familiar with Terraform, I recommend exploring the "aws_terraform_creation" directory. This section not only streamlines the process but also offers valuable insights into module separation techniques.
For those familiar with Terraform, you can streamline the process of initializing the CI/CD and Monitoring Server using the provided configuration in the "terraform_provision_aws" folder within the git repository. Here's a quick guide:
- Navigate to the "terraform_provision_aws" directory
- Run
terraform initto initialize the Terraform working directory
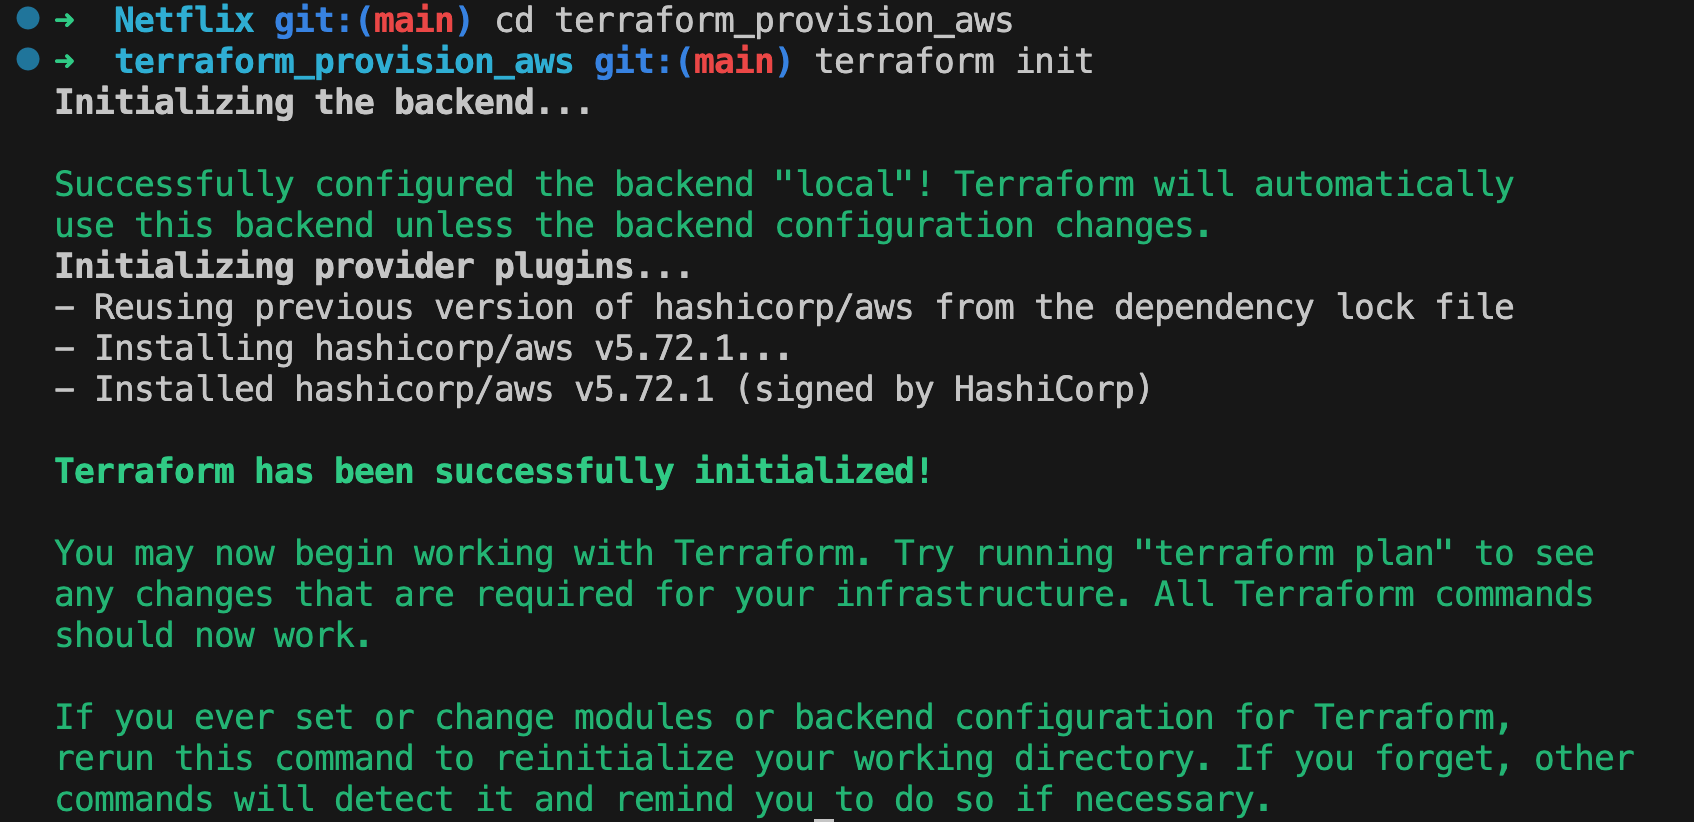
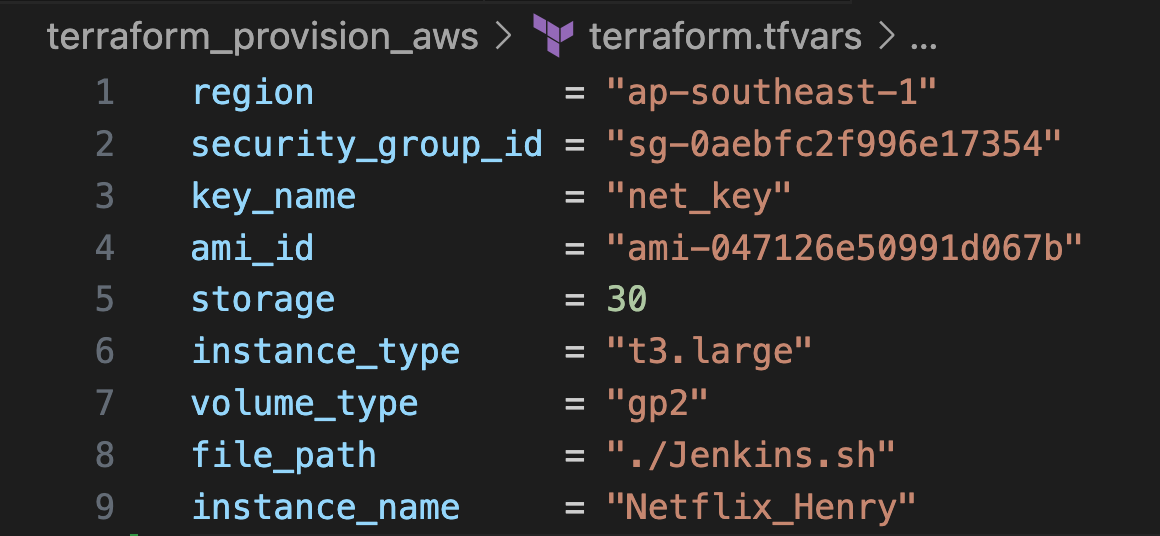
- Modify the necessary values in the Terraform configuration files to suit your needs. Edit this file for your values “terraform.tfvars”
- Apply the Terraform configuration to provision your infrastructure
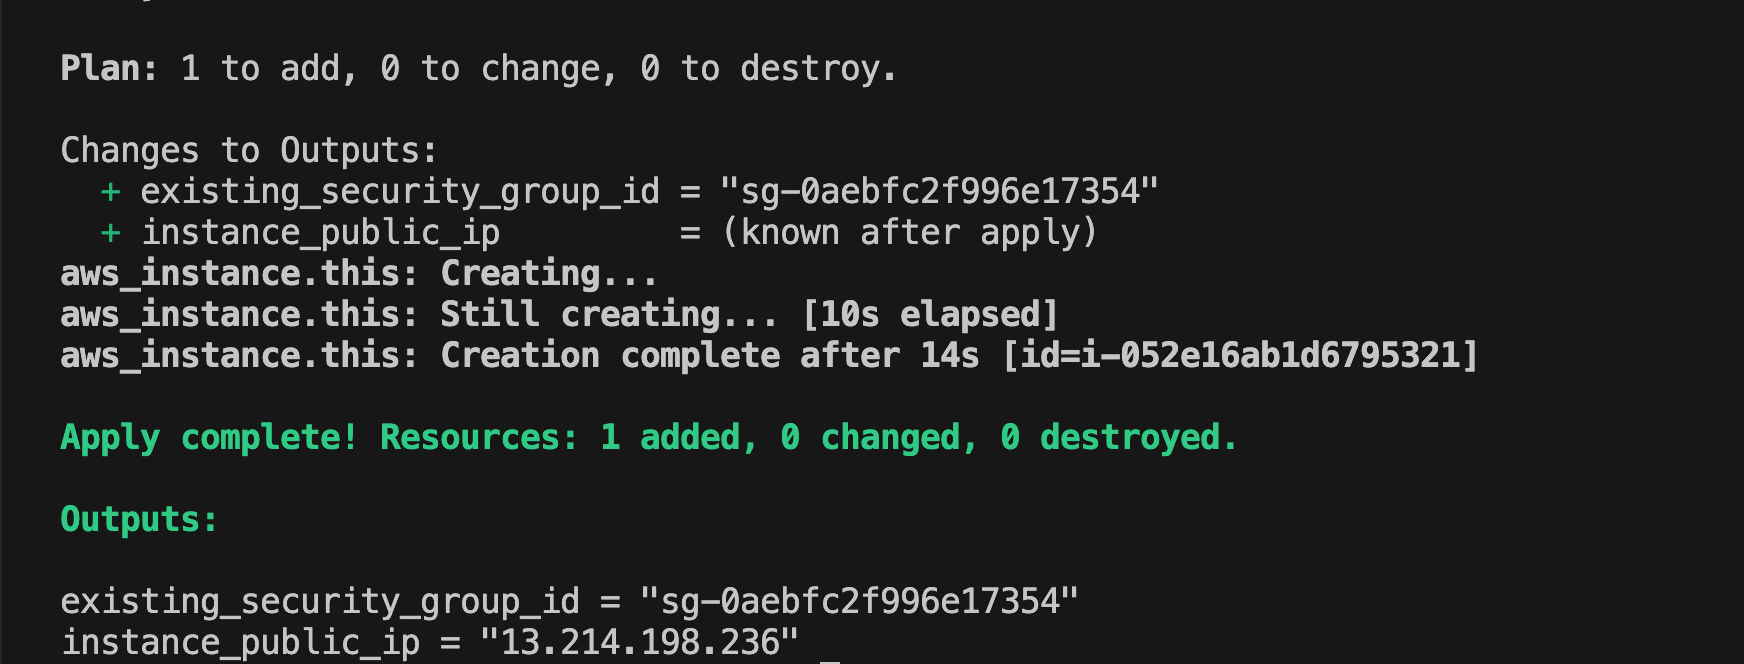
Using this Terraform setup allows you to skip Steps 1 through 6, as well as the Grafana, Prometheus, and node_exporter installation steps. This approach streamlines the infrastructure provisioning process.
Steps 1-6: VM Provisioning with UserData
If you don't have a VM and want to create a new one from AWS using this userdata, you can skip Steps 1 to 6. You can also skip installing Grafana.
NOTE: Some steps may require additional configuration.
#!/bin/bash
sudo apt update -y
wget -O - https://packages.adoptium.net/artifactory/api/gpg/key/public | tee /etc/apt/keyrings/adoptium.asc
echo "deb [signed-by=/etc/apt/keyrings/adoptium.asc] https://packages.adoptium.net/artifactory/deb $(awk -F= '/^VERSION_CODENAME/{print$2}' /etc/os-release) main" | tee /etc/apt/sources.list.d/adoptium.list
sudo apt update -y
sudo apt install temurin-17-jdk -y
/usr/bin/java --version
curl -fsSL https://pkg.jenkins.io/debian-stable/jenkins.io-2023.key | sudo tee /usr/share/keyrings/jenkins-keyring.asc > /dev/null
echo deb [signed-by=/usr/share/keyrings/jenkins-keyring.asc] https://pkg.jenkins.io/debian-stable binary/ | sudo tee /etc/apt/sources.list.d/jenkins.list > /dev/null
sudo apt update -y
sudo apt install jenkins -y
#install docker
sudo apt update -y
sudo apt install docker.io docker-compose -y
sudo usermod -aG docker $(whoami)
newgrp docker
sudo chmod 777 /var/run/docker.sock
# Create a temporary directory
temp_dir="/tmp/docker_compose"
mkdir -p "$temp_dir"
cat > "$temp_dir/docker-compose.yml" <<EOF
version: "3"
services:
  sonarqube:
    image: sonarqube:latest
    ports:
      - "9000:9000"
    environment:
      - SONAR_JDBC_URL=jdbc:postgresql://db:5432/sonar
      - SONAR_JDBC_USERNAME=sonar
      - SONAR_JDBC_PASSWORD=sonar
    volumes:
      - sonarqube_data:/opt/sonarqube/data
      - sonarqube_extensions:/opt/sonarqube/extensions
      - sonarqube_logs:/opt/sonarqube/logs
    depends_on:
      - db

  db:
    image: postgres:12
    environment:
      - POSTGRES_USER=sonar
      - POSTGRES_PASSWORD=sonar
    volumes:
      - postgresql:/var/lib/postgresql
      - postgresql_data:/var/lib/postgresql/data

volumes:
  sonarqube_data:
  sonarqube_extensions:
  sonarqube_logs:
  postgresql:
  postgresql_data:
EOF
# Run Docker Compose
cd $temp_dir
docker-compose up -d
cd
# install trivy
sudo apt install wget apt-transport-https gnupg lsb-release -y
wget -qO - https://aquasecurity.github.io/trivy-repo/deb/public.key | gpg --dearmor | sudo tee /usr/share/keyrings/trivy.gpg > /dev/null
echo "deb [signed-by=/usr/share/keyrings/trivy.gpg] https://aquasecurity.github.io/trivy-repo/deb $(lsb_release -sc) main" | sudo tee -a /etc/apt/sources.list.d/trivy.list
sudo apt update -y
sudo apt install trivy -y
#install Grafana on Jenkins Server
wget -q -O - https://packages.grafana.com/gpg.key | sudo apt-key add -
echo "deb https://packages.grafana.com/oss/deb stable main" | sudo tee -a /etc/apt/sources.list.d/grafana.list
sudo apt update -y
sudo apt install grafana -y
sudo systemctl start grafana-server
sudo systemctl enable grafana-server
#install Kubectl on Jenkins Server
sudo apt update -y
sudo apt install curl -y
curl -LO https://dl.k8s.io/release/$(curl -L -s https://dl.k8s.io/release/stable.txt)/bin/linux/amd64/kubectl
sudo install -o root -g root -m 0755 kubectl /usr/local/bin/kubectl
kubectl version --client
#Create a system user for Prometheus
sudo useradd --system --no-create-home --shell /bin/false prometheus
#Create directories for Prometheus
sudo mkdir -p /data /etc/prometheus
#Download and install Prometheus
wget https://github.com/prometheus/prometheus/releases/download/v2.53.2/prometheus-2.53.2.linux-amd64.tar.gz
tar -xvf prometheus-2.53.2.linux-amd64.tar.gz
sudo mv prometheus-2.53.2.linux-amd64/prometheus /usr/local/bin/
sudo mv prometheus-2.53.2.linux-amd64/promtool /usr/local/bin/
sudo mv prometheus-2.53.2.linux-amd64/consoles/ /etc/prometheus/
sudo mv prometheus-2.53.2.linux-amd64/console_libraries/ /etc/prometheus/
sudo mv prometheus-2.53.2.linux-amd64/prometheus.yml /etc/prometheus/prometheus.yml
#Configure Prometheus
cat <<EOL | sudo tee /etc/prometheus/prometheus.yml
# my global config
global:
  scrape_interval: 15s # Set the scrape interval to every 15 seconds. Default is every 1 minute.
  evaluation_interval: 15s # Evaluate rules every 15 seconds. The default is every 1 minute.
  # scrape_timeout is set to the global default (10s).

# Alertmanager configuration
alerting:
  alertmanagers:
    - static_configs:
        - targets:
          # - alertmanager:9093

# Load rules once and periodically evaluate them according to the global 'evaluation_interval'.
rule_files:
  # - "first_rules.yml"
  # - "second_rules.yml"

# A scrape configuration containing exactly one endpoint to scrape:
# Here it's Prometheus itself.
scrape_configs:
  # The job name is added as a label `job=<job_name>` to any timeseries scraped from this config.
  - job_name: "prometheus"

    # metrics_path defaults to '/metrics'
    # scheme defaults to 'http'.

    static_configs:
      - targets: ["localhost:7718"]

  - job_name: node_export
    static_configs:
      - targets: ["localhost:9101"]

  - job_name: 'Jenkins'
    metrics_path: '/prometheus'
    static_configs:
      - targets: ['localhost:8080']
EOL
sudo chown -R prometheus:prometheus /etc/prometheus/ /data/
rm -rf prometheus-2.53.2.linux-amd64
rm -f prometheus-2.53.2.linux-amd64.tar.gz
#Create a Prometheus service file
cat <<EOL | sudo tee /etc/systemd/system/prometheus.service
[Unit]
Description=Prometheus
Wants=network-online.target
After=network-online.target

StartLimitIntervalSec=500
StartLimitBurst=5

[Service]
User=prometheus
Group=prometheus
Type=simple
Restart=on-failure
RestartSec=5s
ExecStart=/usr/local/bin/prometheus \
  --config.file=/etc/prometheus/prometheus.yml \
  --storage.tsdb.path=/data \
  --web.console.templates=/etc/prometheus/consoles \
  --web.console.libraries=/etc/prometheus/console_libraries \
  --web.listen-address=0.0.0.0:7718 \
  --web.enable-lifecycle

[Install]
WantedBy=multi-user.target
EOL
sudo systemctl daemon-reload
sudo systemctl start prometheus
sudo systemctl enable prometheus
#Install and Configure Node Exporter
sudo useradd --system --no-create-home --shell /bin/false node_exporter
#Download and install Node Exporter
wget https://github.com/prometheus/node_exporter/releases/download/v1.8.2/node_exporter-1.8.2.linux-amd64.tar.gz
tar xvf node_exporter-1.8.2.linux-amd64.tar.gz
sudo mv node_exporter-1.8.2.linux-amd64/node_exporter /usr/local/bin/
rm -rf node_exporter*
#Create a Node Exporter service file
cat <<EOL | sudo tee /etc/systemd/system/node_exporter.service
[Unit]
Description=Node Exporter
Wants=network-online.target
After=network-online.target

[Service]
User=node_exporter
Group=node_exporter
Type=simple
ExecStart=/usr/local/bin/node_exporter --web.listen-address=:9101

[Install]
WantedBy=multi-user.target
EOL
#Start and enable Node Exporter service
sudo systemctl daemon-reload
sudo systemctl start node_exporter
sudo systemctl enable node_exporter
#Check Prometheus configuration and reload
promtool check config /etc/prometheus/prometheus.yml
curl -X POST http://localhost:7718/-/reload
Steps 1-6 (Optional: For Manual EC2 Provisioning)
Step 1: Install Java
sudo apt update
sudo apt install fontconfig openjdk-17-jre
java -version
openjdk version "17.0.8" 2023-07-18
OpenJDK Runtime Environment (build 17.0.8+7-Debian-1deb12u1)
OpenJDK 64-Bit Server VM (build 17.0.8+7-Debian-1deb12u1, mixed mode, sharing)
Step 2: Install Jenkins
Long Term Support release
An LTS (Long-Term Support) release is selected every 12 weeks from the regular release stream as the stable version for that period. You can install it from the
debian-stableapt repository.sudo wget -O /usr/share/keyrings/jenkins-keyring.asc \ https://pkg.jenkins.io/debian-stable/jenkins.io-2023.key echo "deb [signed-by=/usr/share/keyrings/jenkins-keyring.asc]" \ https://pkg.jenkins.io/debian-stable binary/ | sudo tee \ /etc/apt/sources.list.d/jenkins.list> /dev/null sudo apt-get update sudo apt-get install jenkinsWeekly release
A new release is produced weekly to deliver bug fixes and features to users and plugin developers. You can install it from the
debianapt repository.sudo wget -O /usr/share/keyrings/jenkins-keyring.asc \ https://pkg.jenkins.io/debian/jenkins.io-2023.key echo "deb [signed-by=/usr/share/keyrings/jenkins-keyring.asc]" \ https://pkg.jenkins.io/debian binary/ | sudo tee \ /etc/apt/sources.list.d/jenkins.list <b>></b> /dev/null sudo apt-get update sudo apt-get install jenkins sudo systemctl enable jenkins sudo systemctl start jenkins sudo systemctl status jenkinsStep 3: Install Docker and Docker Compose
Install Docker
sudo apt-get update
sudo apt-get install ca-certificates curl gnupg

sudo install -m 0755 -d /etc/apt/keyrings
curl -fsSL https://download.docker.com/linux/ubuntu/gpg | sudo gpg --dearmor -o /etc/apt/keyrings/docker.gpg
sudo chmod a+r /etc/apt/keyrings/docker.gpg

echo \
  "deb [arch="$(dpkg --print-architecture)" signed-by=/etc/apt/keyrings/docker.gpg] https://download.docker.com/linux/ubuntu \
  "$(. /etc/os-release && echo "$VERSION_CODENAME")" stable" | \
  sudo tee /etc/apt/sources.list.d/docker.list > /dev/null

sudo apt-get update
sudo apt-get install docker-ce docker-ce-cli containerd.io docker-buildx-plugin docker-compose-plugin
Install Docker Compose
sudo curl -L "https://github.com/docker/compose/releases/download/1.29.2/docker-compose-$(uname -s)-$(uname -m)" -o /usr/local/bin/docker-compose
sudo chmod +x /usr/local/bin/docker-compose
docker-compose --version
With Docker and Docker Compose now installed, we're ready to move on to the next crucial steps in our CI/CD pipeline setup.
Step 4: Install Trivy
Trivy is a powerful, all-in-one vulnerability scanner for containers and other artifacts. Let's walk through its installation:
sudo apt-get install wget apt-transport-https gnupg lsb-release
wget -qO - https://aquasecurity.github.io/trivy-repo/deb/public.key | sudo apt-key add -
echo deb https://aquasecurity.github.io/trivy-repo/deb $(lsb_release -sc) main | sudo tee -a /etc/apt/sources.list.d/trivy.list
sudo apt-get update
sudo apt-get install trivy
trivy --version
Once installed, Trivy enables you to scan Docker images and filesystems for potential vulnerabilities, enhancing your security practices.
Step 5: Install Kubectl
Kubectl is the command-line tool for interacting with Kubernetes clusters. Here's how to install it:
sudo apt update
sudo apt install curl -y
curl -LO https://dl.k8s.io/release/$(curl -L -s https://dl.k8s.io/release/stable.txt)/bin/linux/amd64/kubectl
sudo install -o root -g root -m 0755 kubectl /usr/local/bin/kubectl
kubectl version --client
After installation, you can use kubectl to manage your Kubernetes clusters. However, you'll need to configure kubectl with your cluster's details for effective use.
Step 6: Set up SonarQube Server with Docker Compose
To set up a SonarQube server using Docker Compose, follow these steps:
1. Create a Docker Compose file
Create a file named
docker-compose.ymlwith this content:version: "3" services: sonarqube: image: sonarqube:latest ports: - "9000:9000" environment: - SONAR_JDBC_URL=jdbc:postgresql://db:5432/sonar - SONAR_JDBC_USERNAME=sonar - SONAR_JDBC_PASSWORD=sonar volumes: - sonarqube_data:/opt/sonarqube/data - sonarqube_extensions:/opt/sonarqube/extensions - sonarqube_logs:/opt/sonarqube/logs depends_on: - db db: image: postgres:12 environment: - POSTGRES_USER=sonar - POSTGRES_PASSWORD=sonar volumes: - postgresql:/var/lib/postgresql - postgresql_data:/var/lib/postgresql/data volumes: sonarqube_data: sonarqube_extensions: sonarqube_logs: postgresql: postgresql_data:2. Start the SonarQube server
Run the following command in the directory containing the
docker-compose.ymlfile:docker-compose up -dThis command will start the SonarQube server and its associated PostgreSQL database in detached mode.
Step 7: Access The Jenkins And SonarQube Servers
Jenkins Server
To access the Jenkins server:
- Open a web browser and navigate to
http://[your-server-ip]:8080
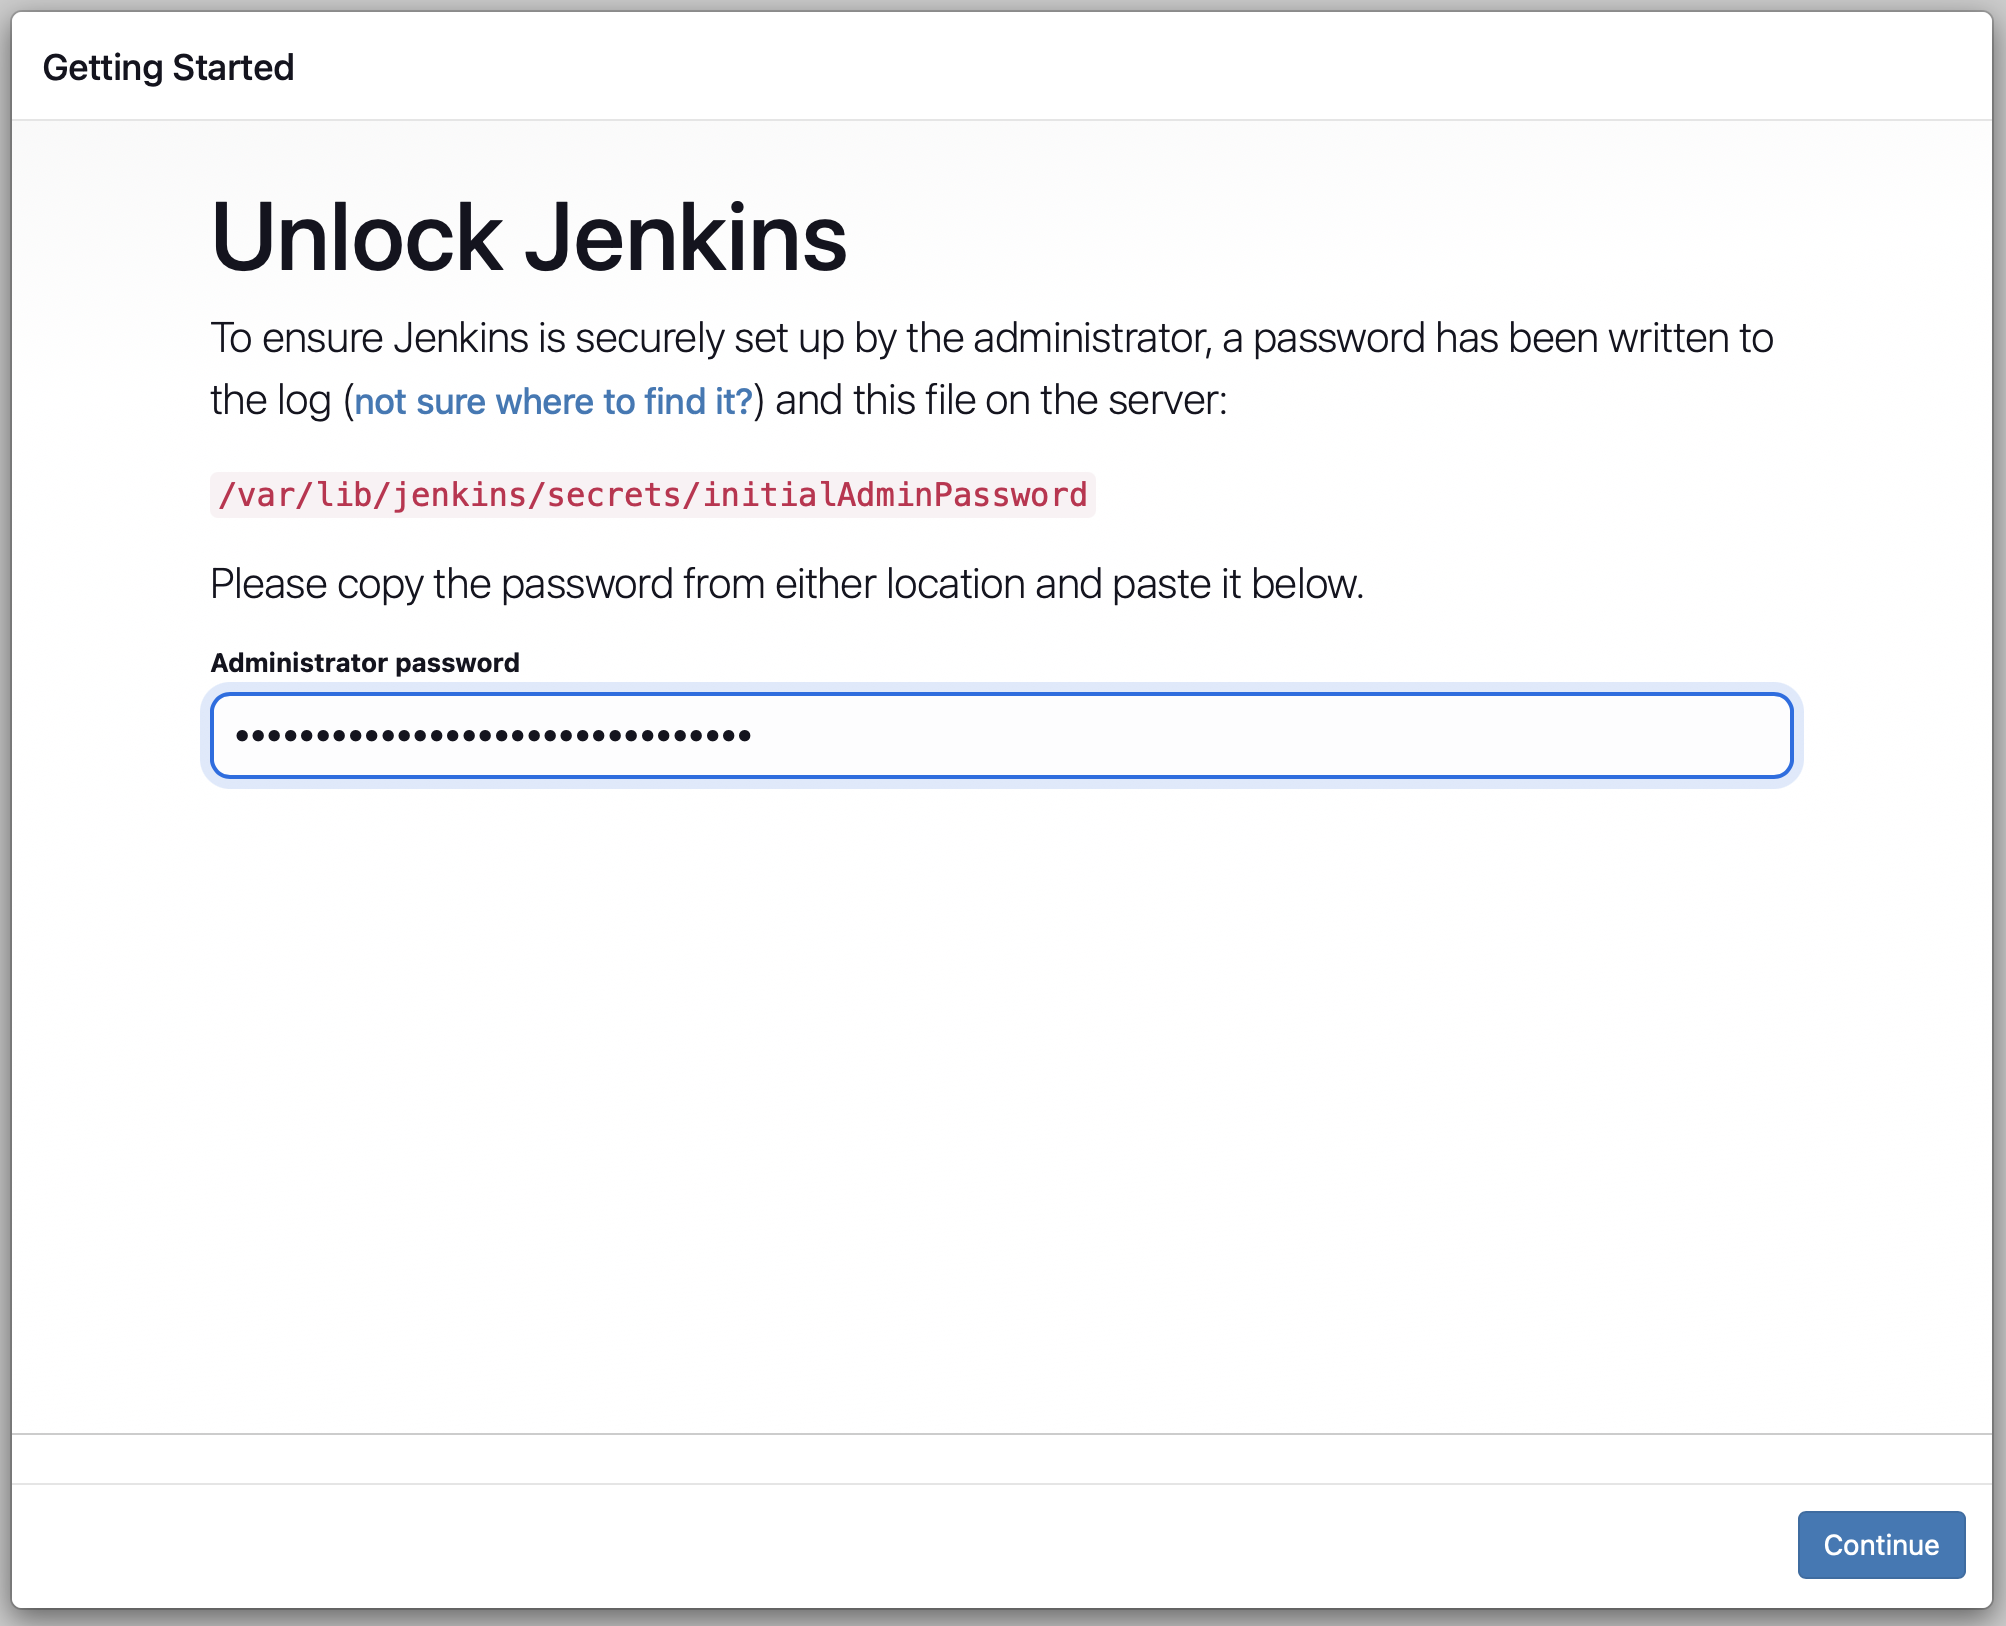
- If this is your first time accessing Jenkins, you'll need to unlock it using the initial admin password:
sudo cat /var/lib/jenkins/secrets/initialAdminPasswordCopy the password and paste it into the Jenkins setup wizard.
SonarQube Server
To access the SonarQube server:
- Open a web browser and navigate to
http://[your-server-ip]:9000
- Use the default login credentials:
- Username: admin
- Password: admin
Remember to change the default password after your first login for security reasons.
With both servers now accessible, you can proceed to configure your Jenkins pipeline to integrate with SonarQube for code quality analysis.
Step 8: Install Suggested Plugins and Create First Admin User
Install Suggested Plugins
After unlocking Jenkins, you'll be prompted to customize Jenkins. For a quick start:
- Select "Install suggested plugins" to get a set of commonly used plugins.
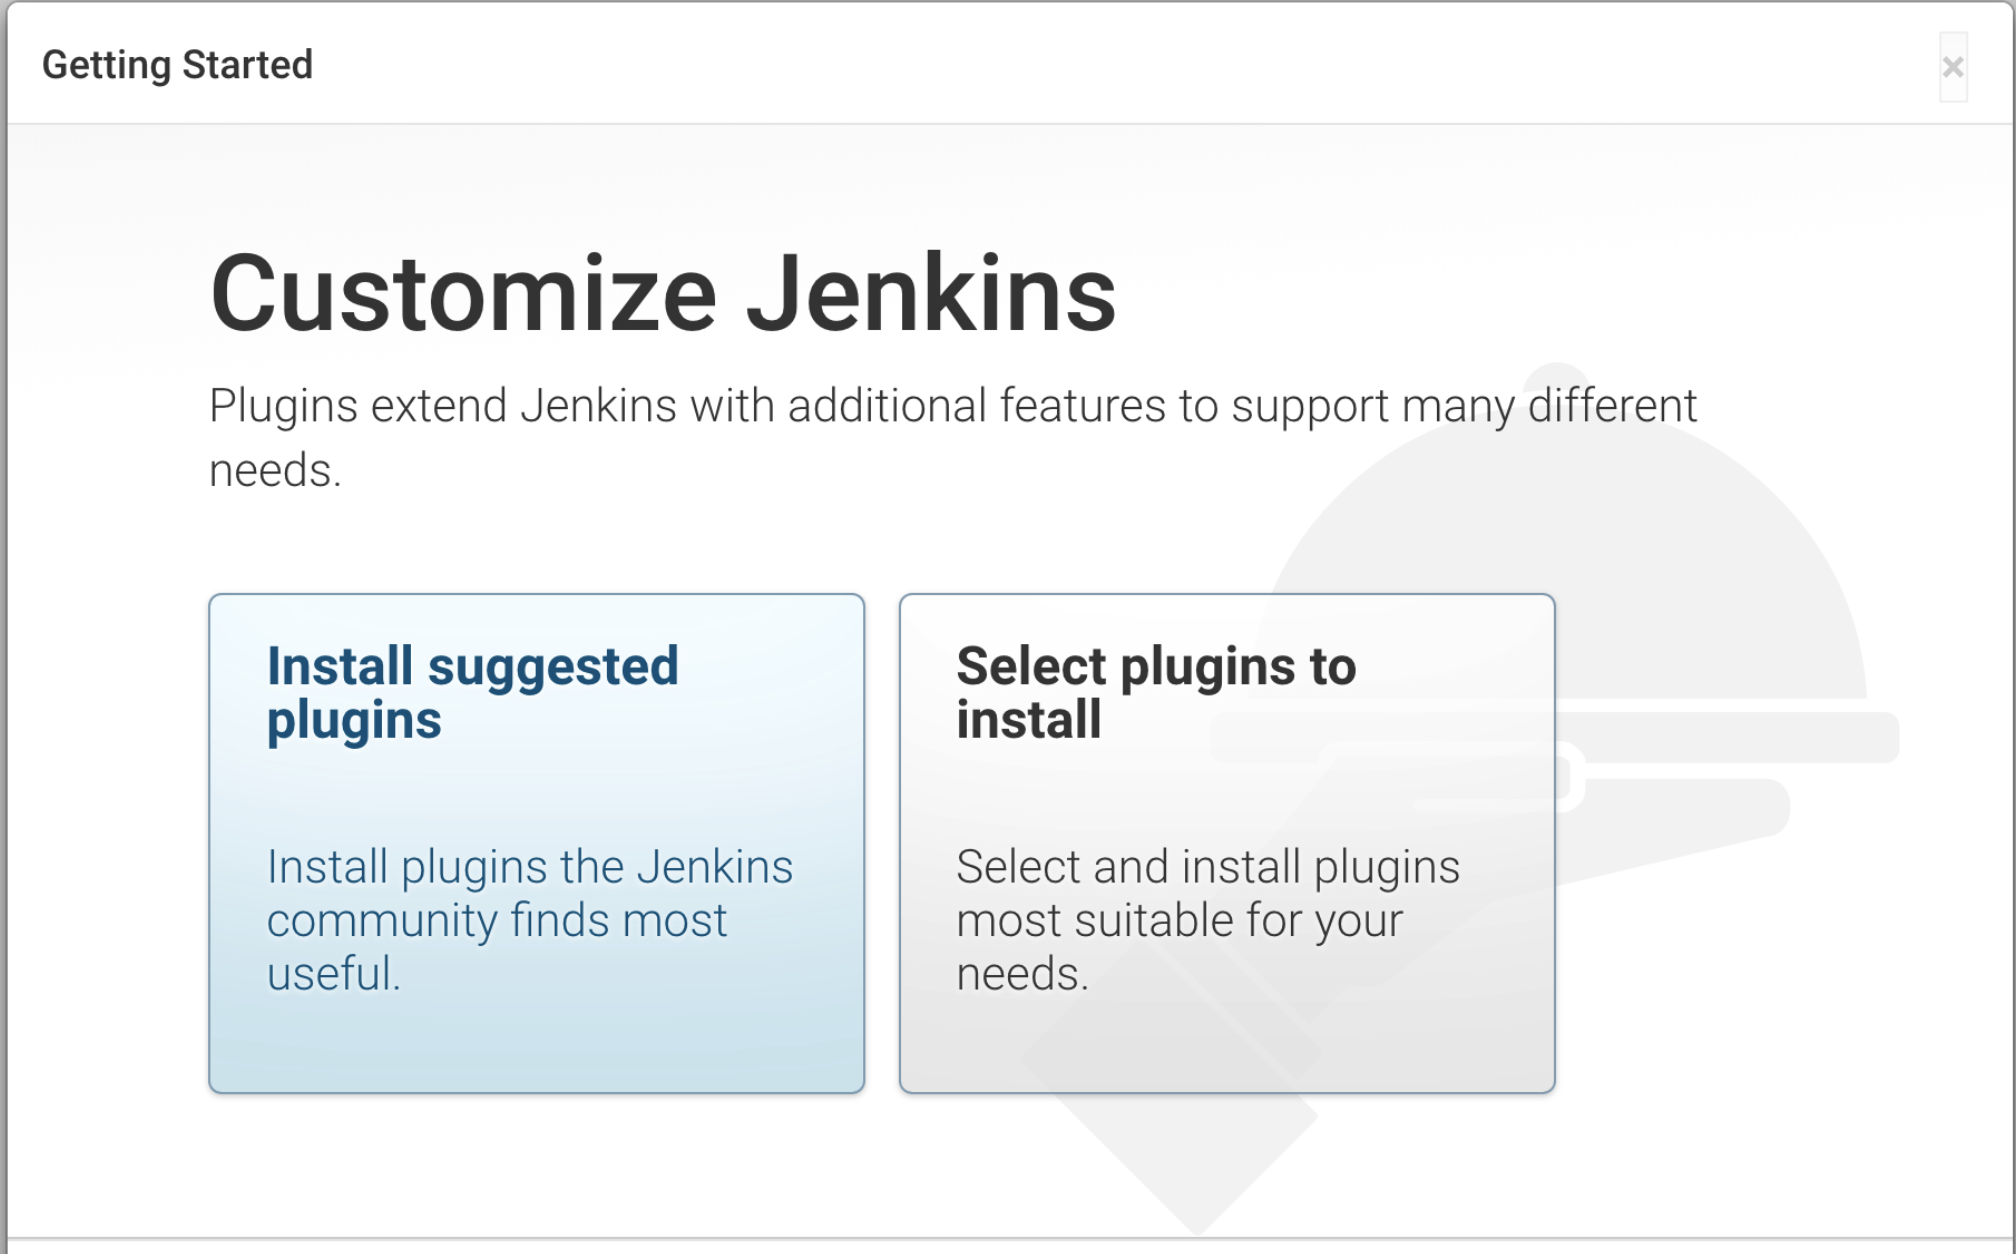
- Wait for the installation to complete. This may take several minutes.

Create First Admin User
Once the plugins are installed, you'll be prompted to create your first admin user:
- Fill in the required fields: Username, Password, Confirm password, Full name, and E-mail address.
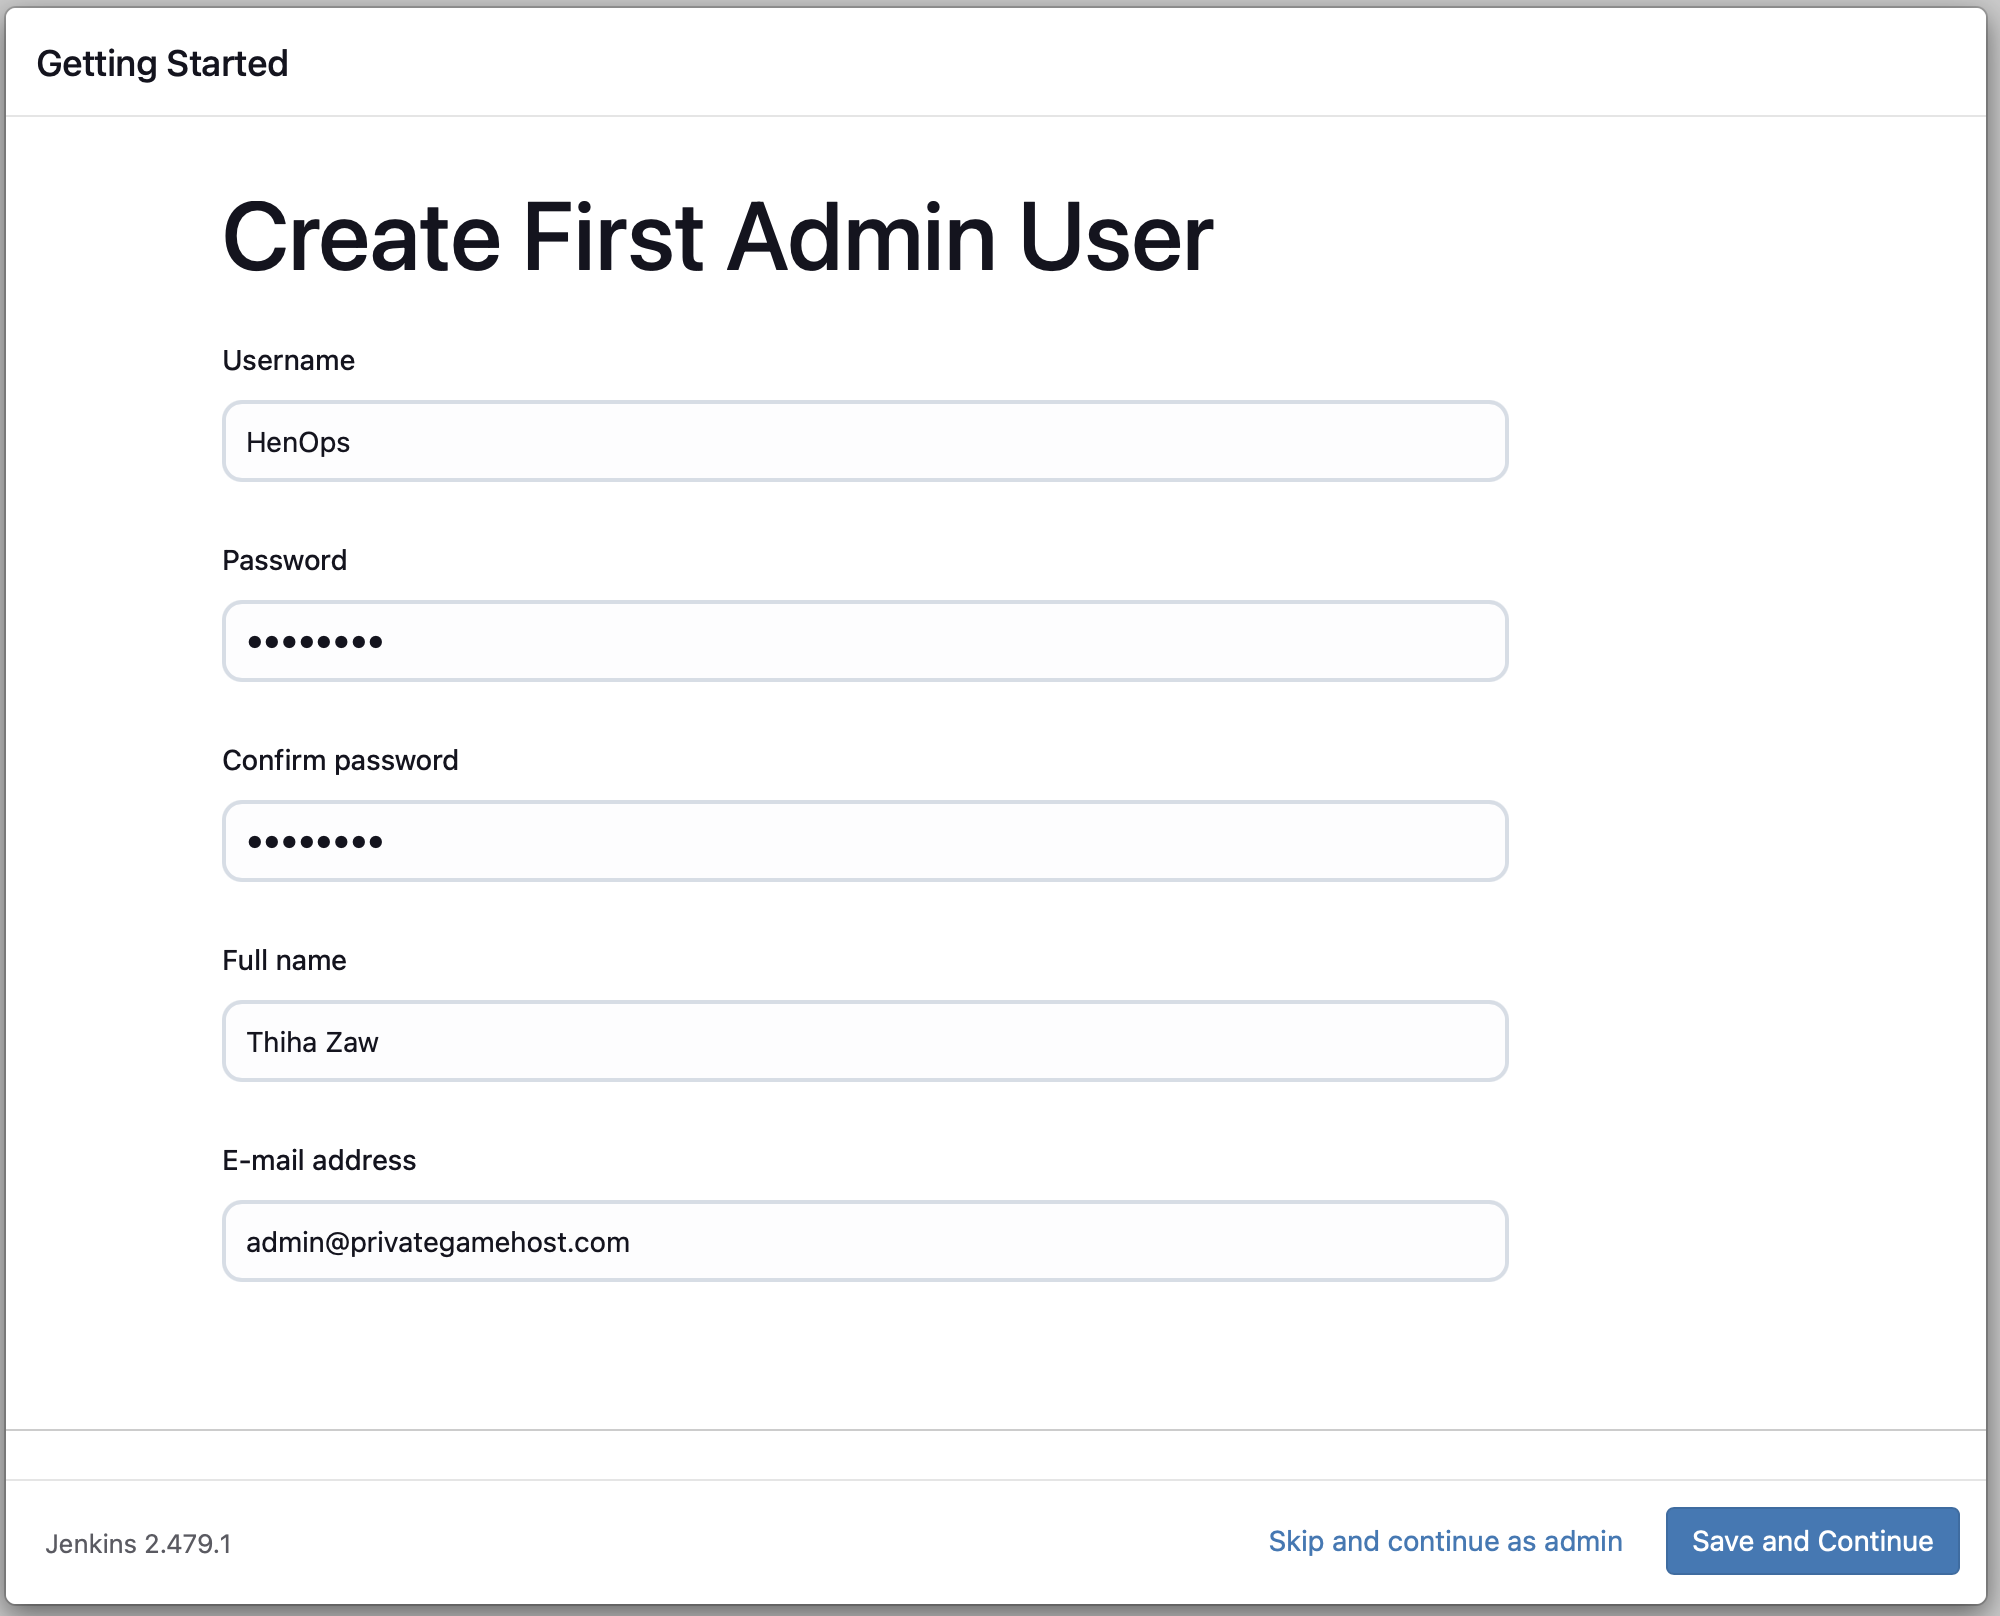
- Click "Save and Continue".
- On the next screen, confirm the Jenkins URL or modify if necessary.
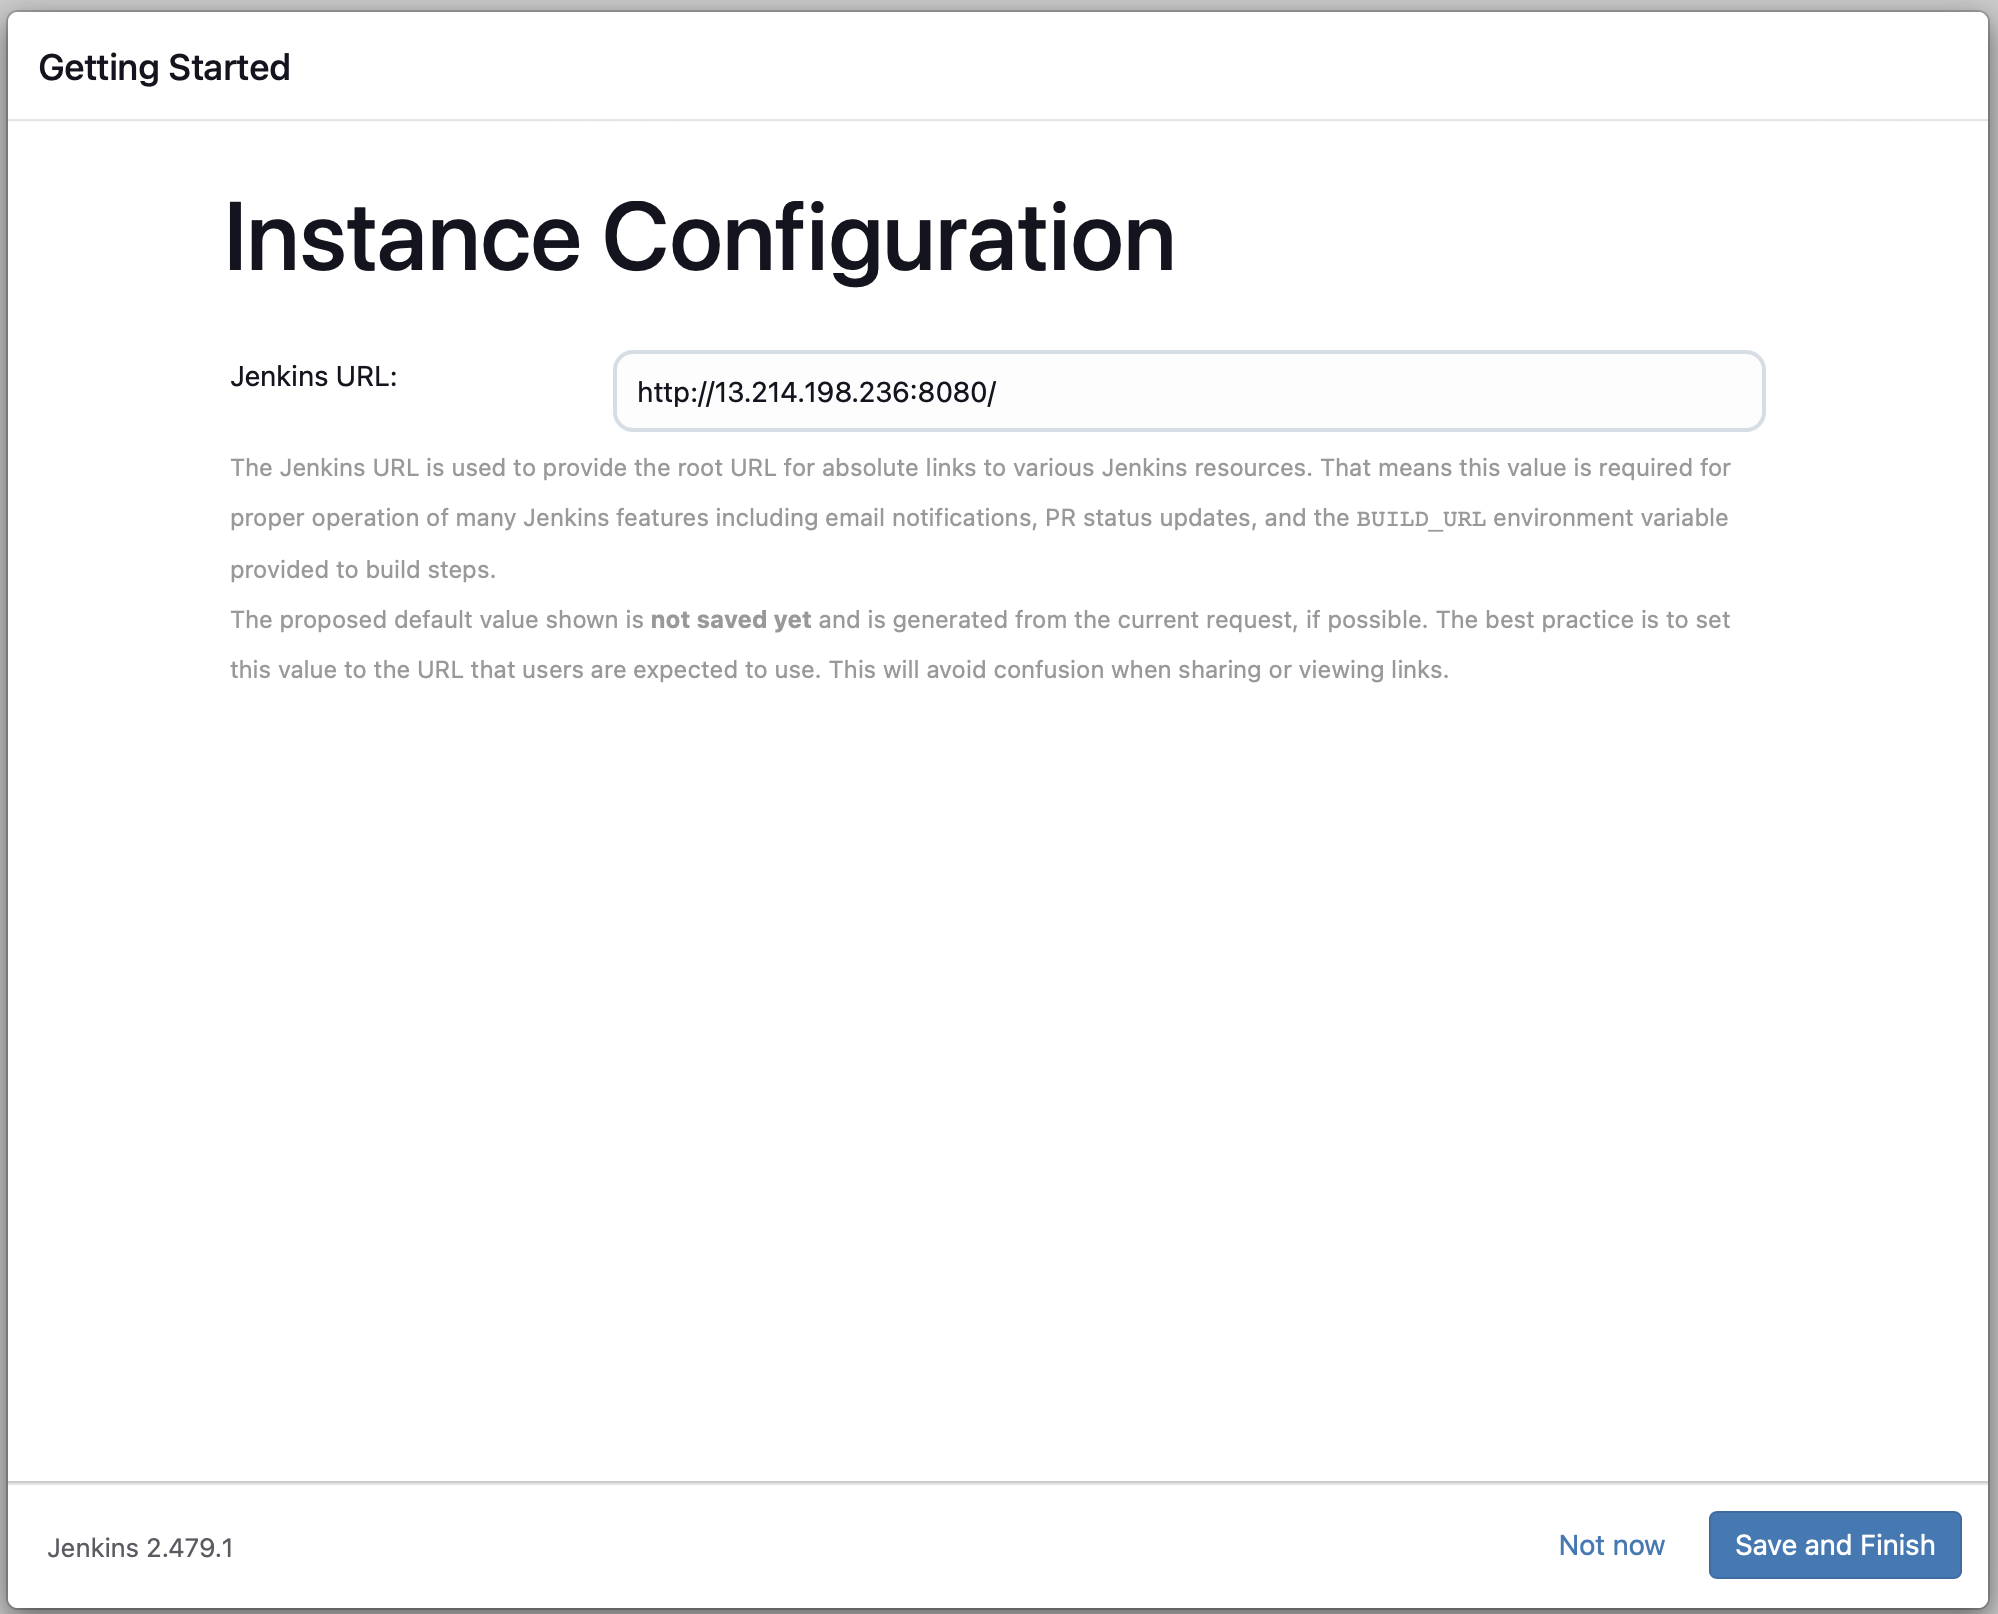
- Click "Save and Finish" to complete the setup.
After these steps, Jenkins will be ready for use with your admin account. You can now start configuring your CI/CD pipeline and integrating with other tools like SonarQube.
Step 9: Create SonarQube Token and Configure Jenkins
Create SonarQube Token
- Log in to your SonarQube server (http://[your-server-ip]:9000)
- Go to User > My Account > Security
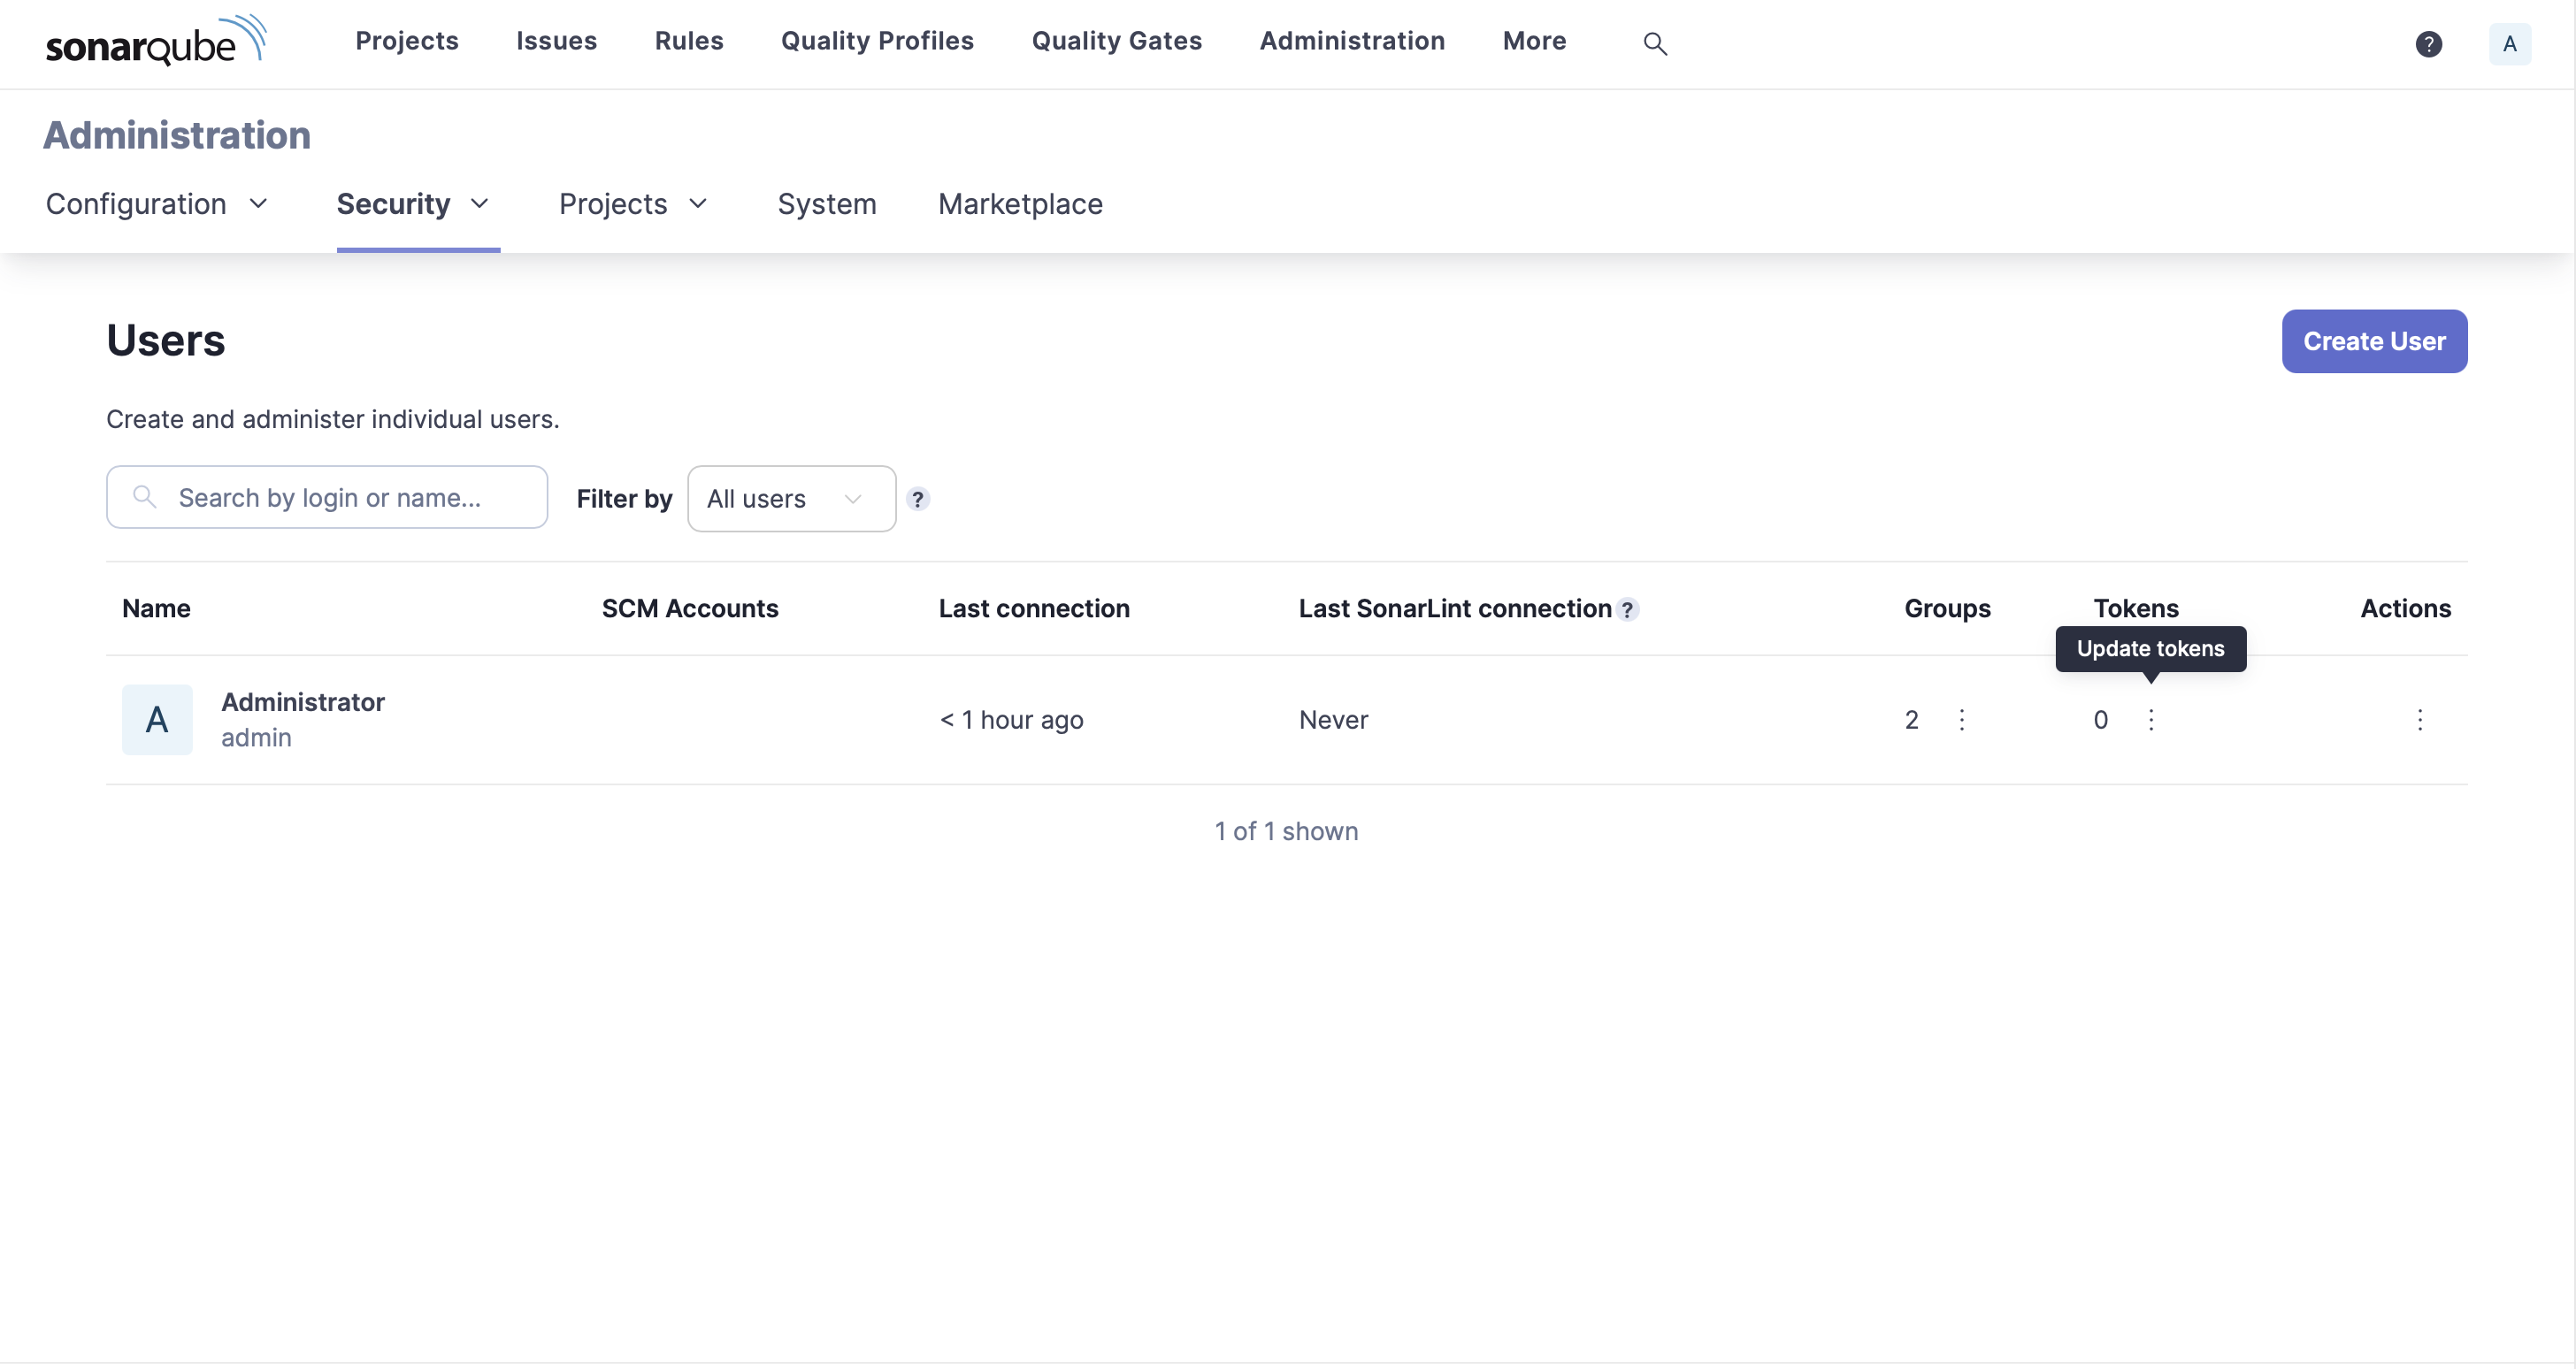
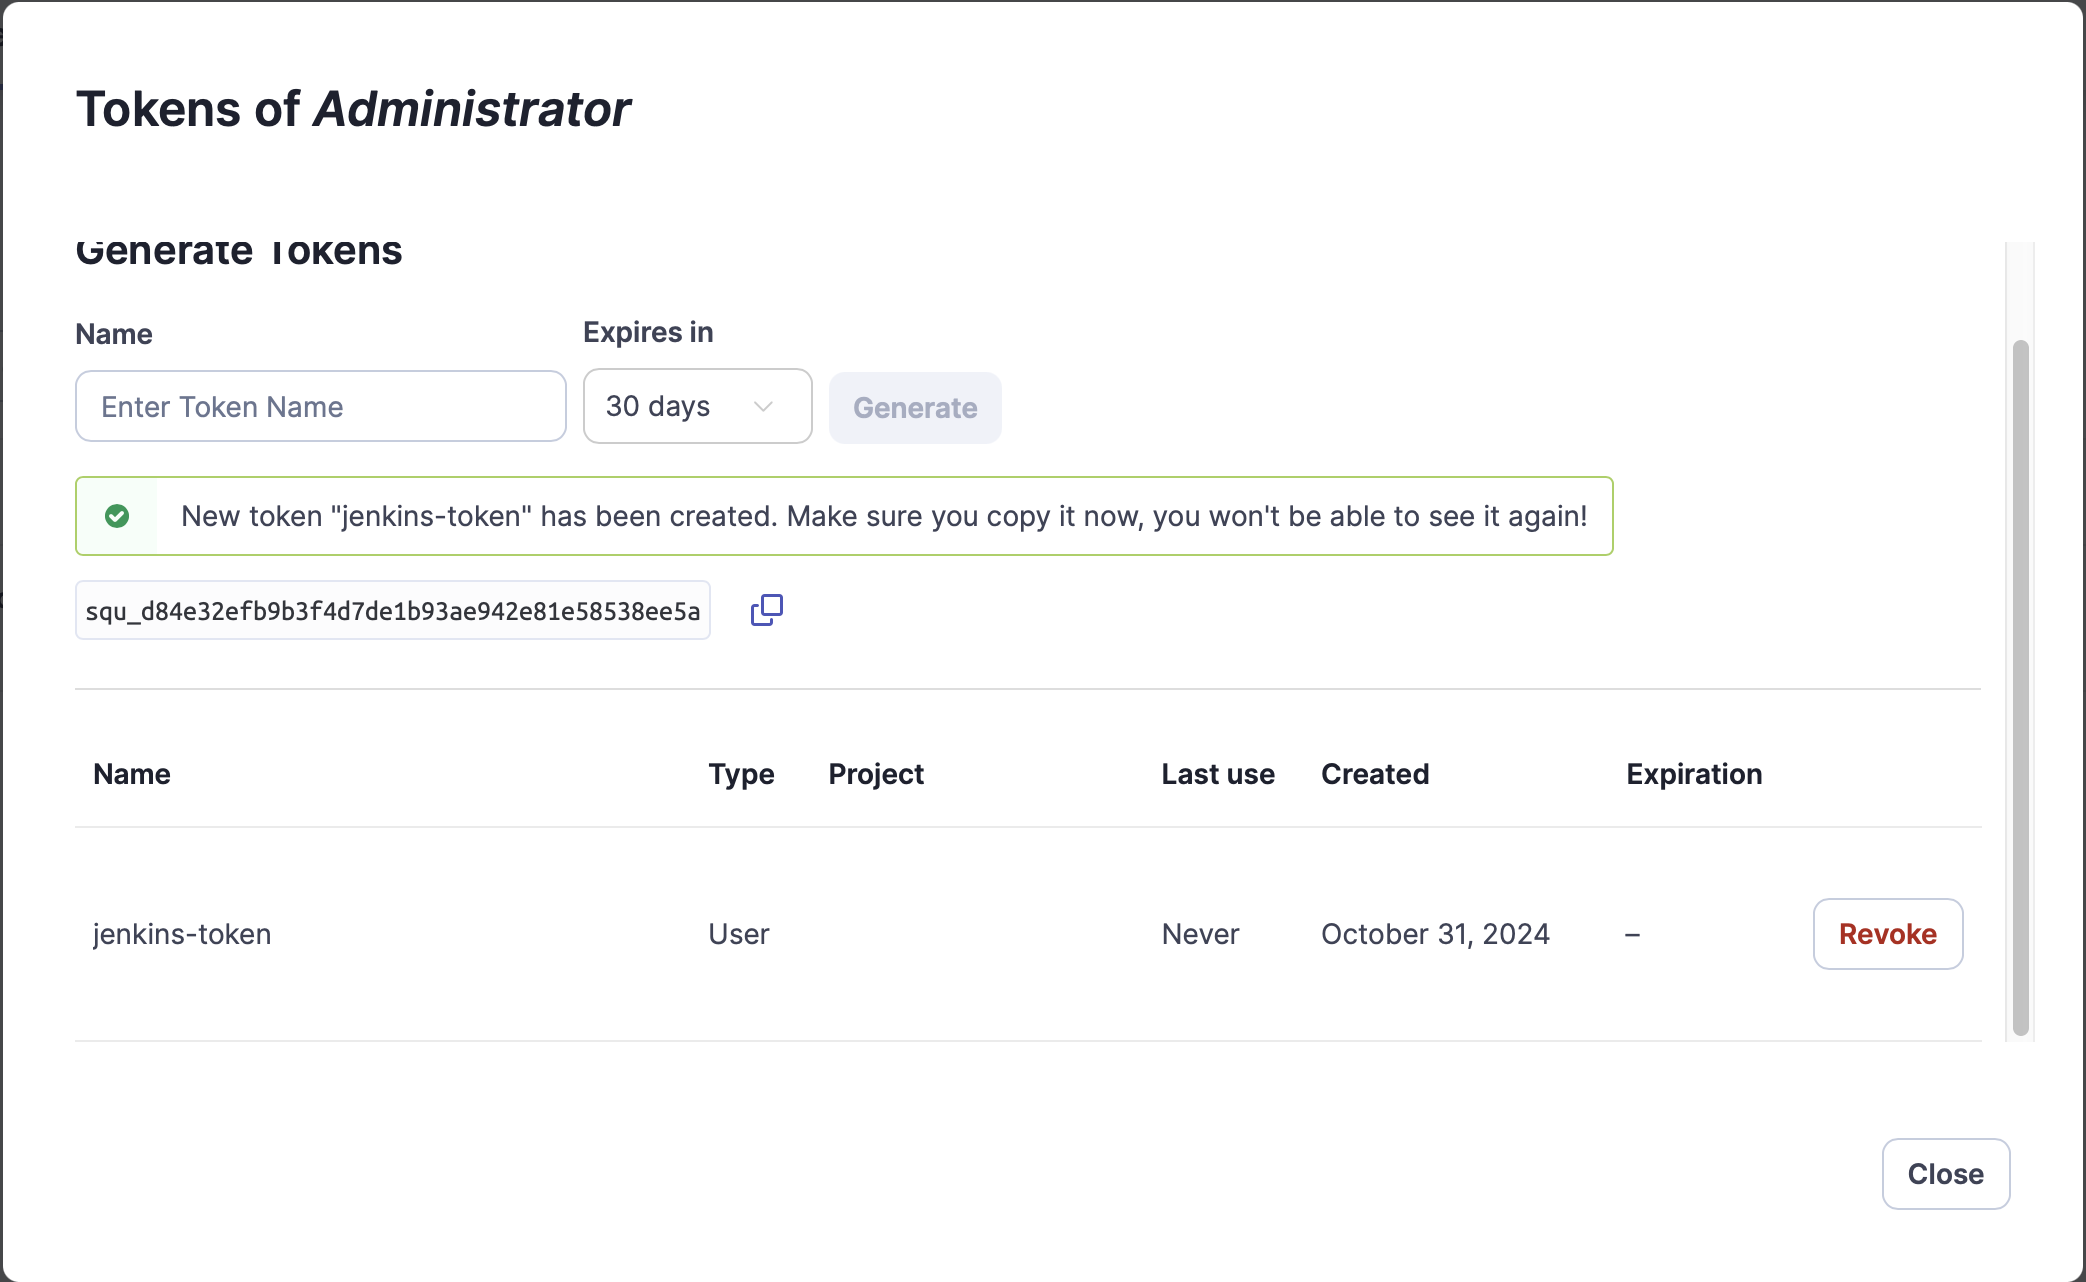
- Enter a name for your token (e.g., "jenkins-token") and click "Generate"
- Copy the generated token immediately (you won't be able to see it again)
Create Jenkins Credentials for SonarQube
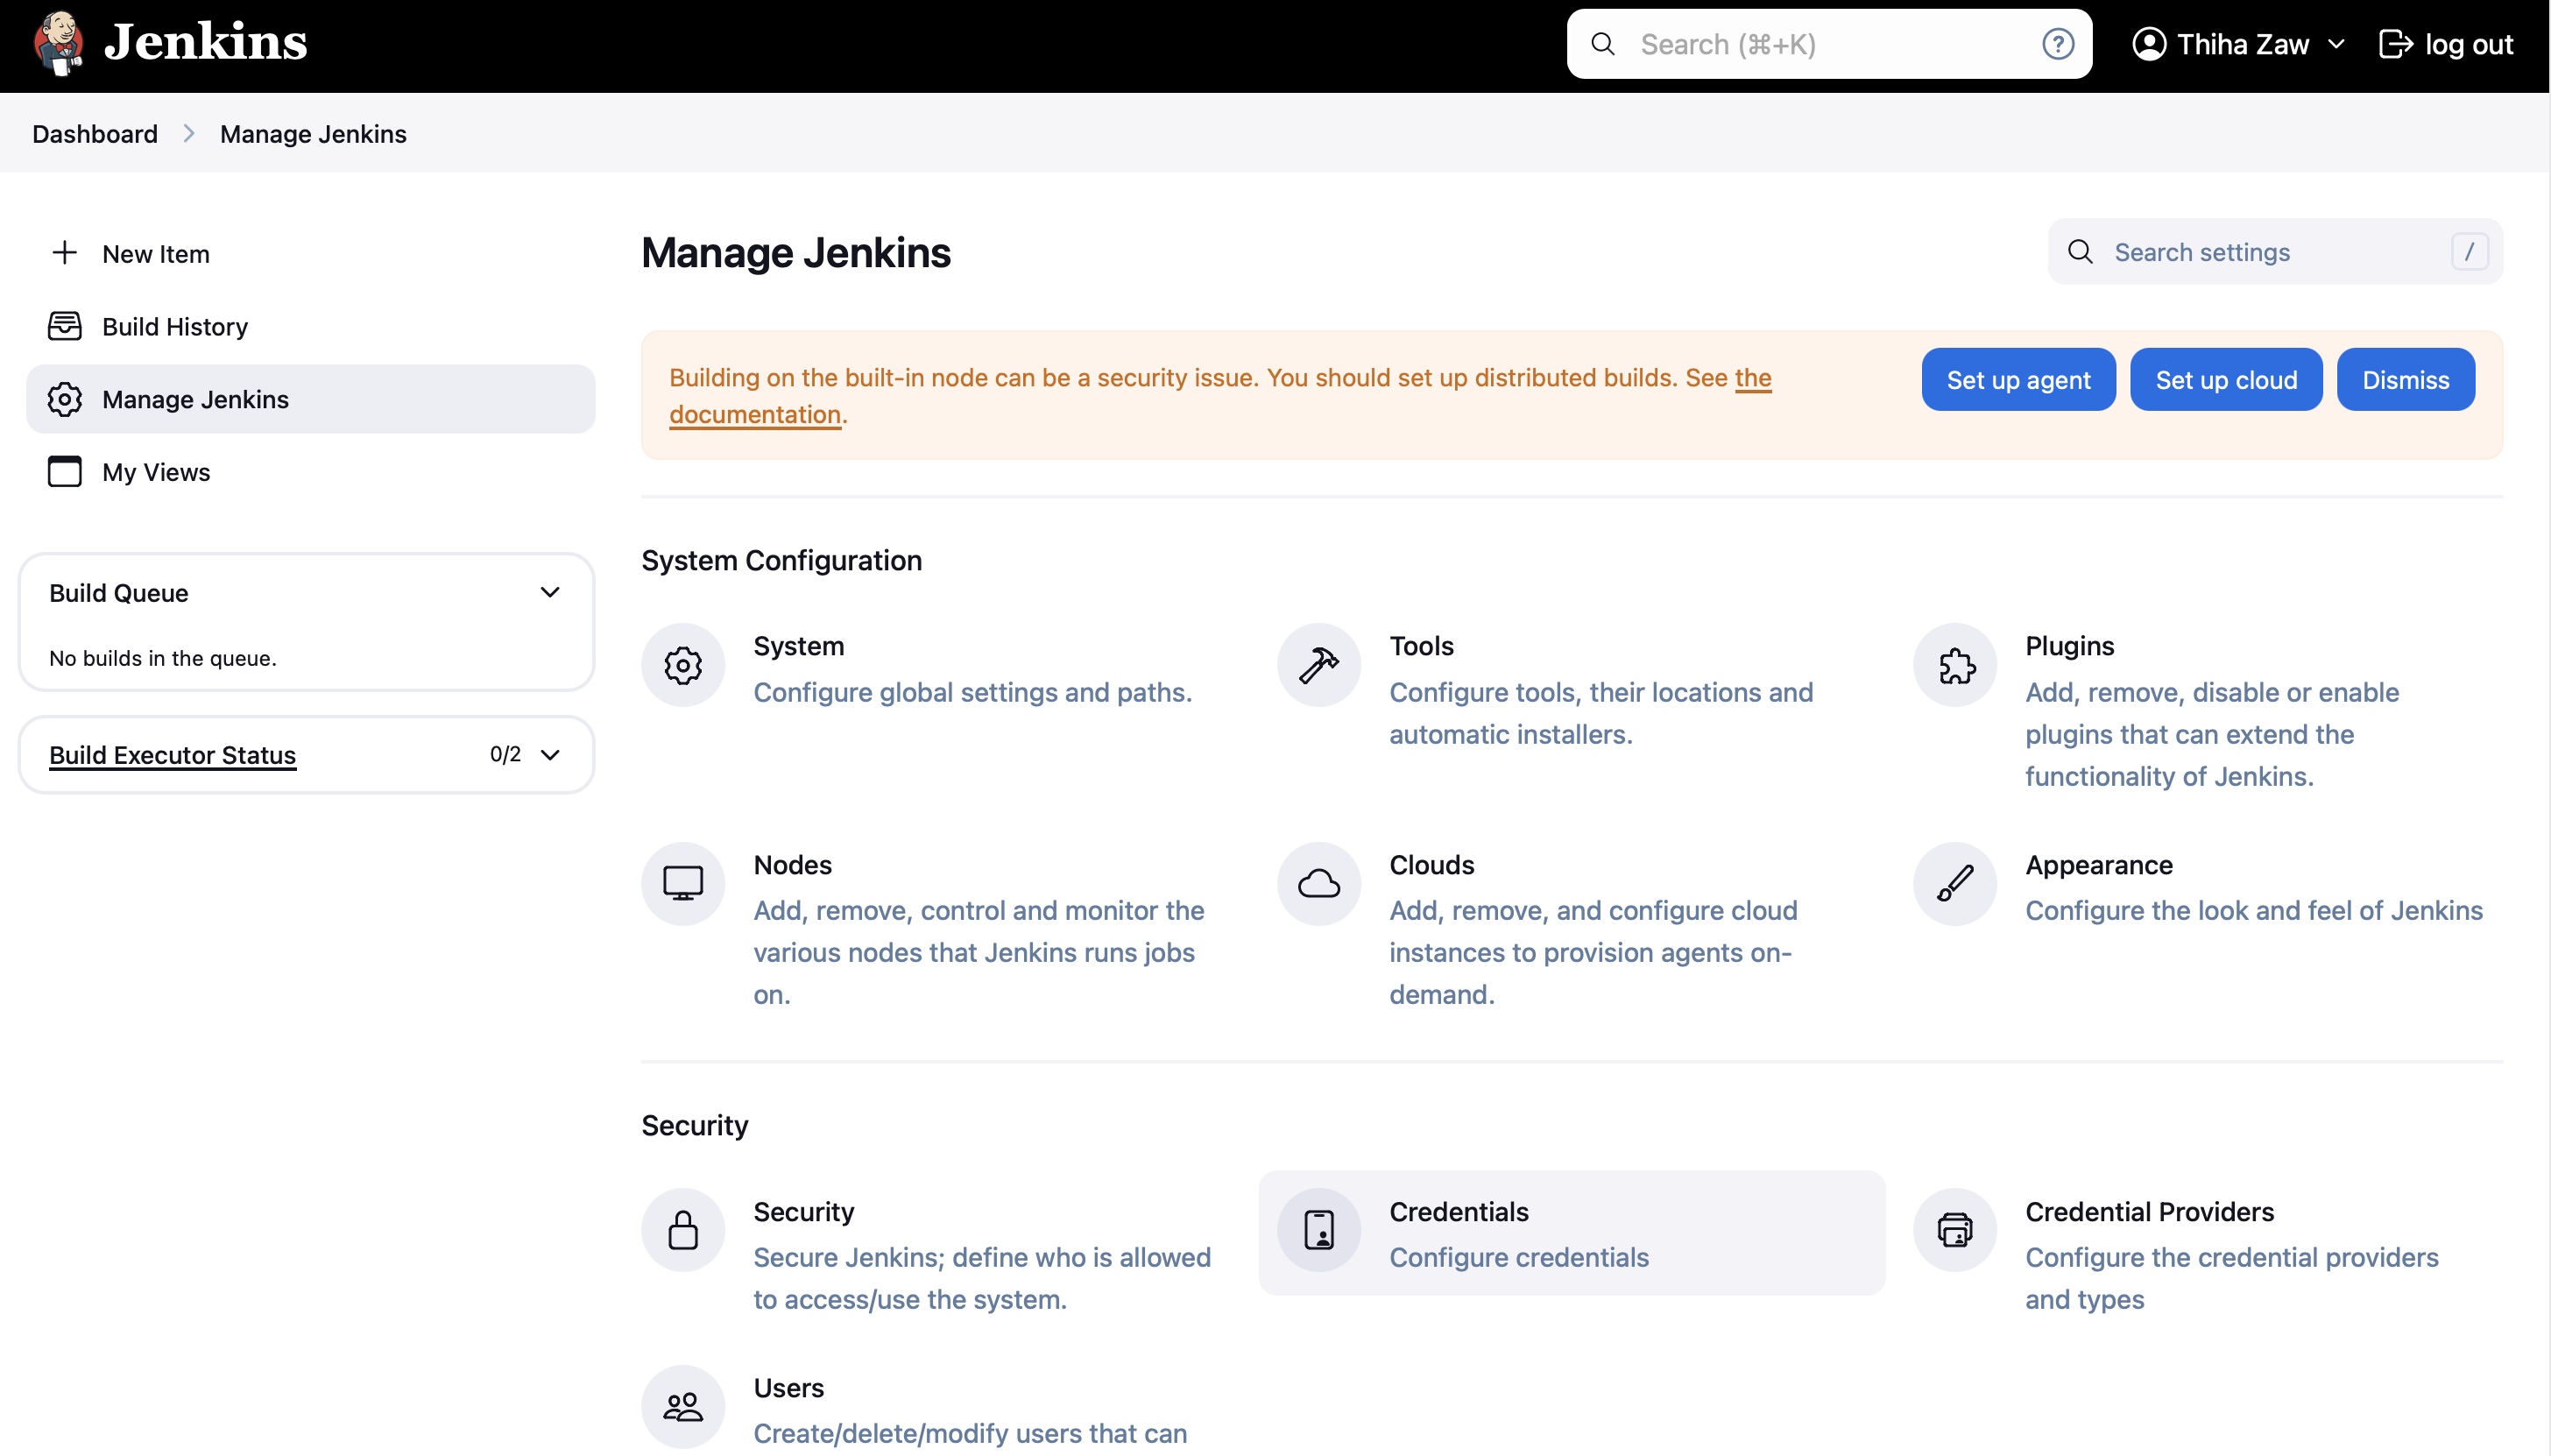
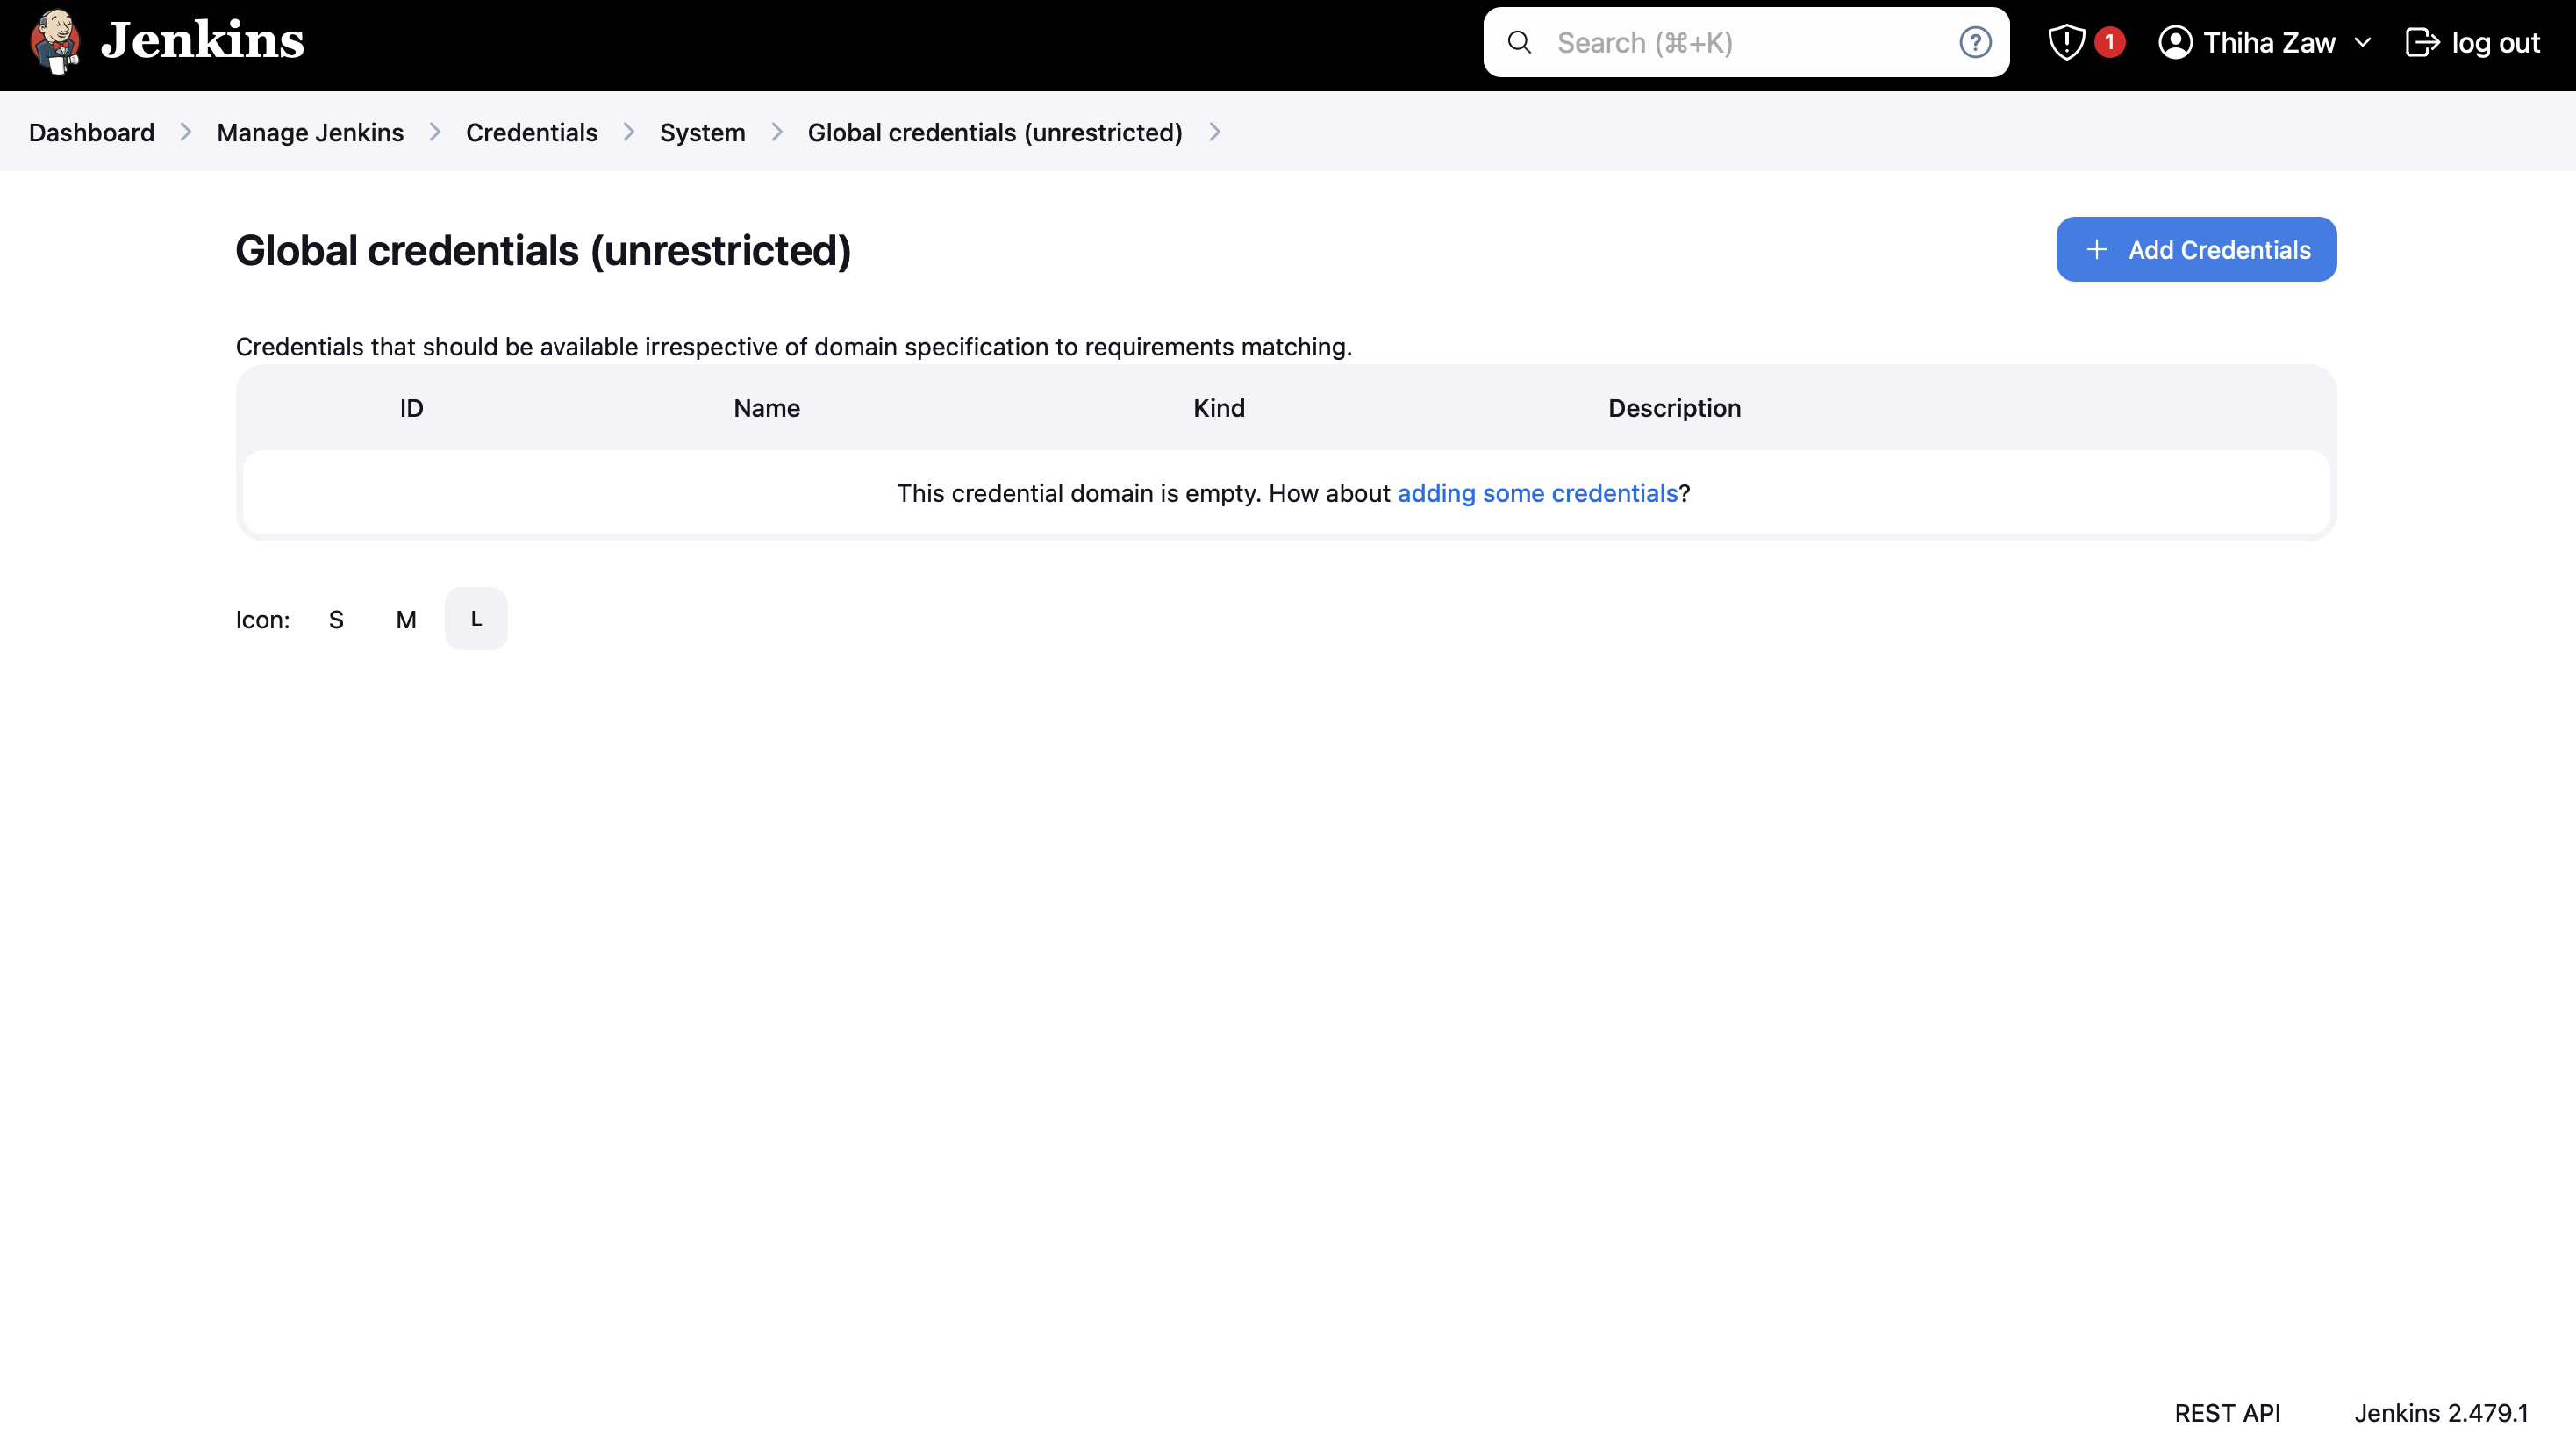
- In Jenkins, go to Manage Jenkins > Manage Credentials
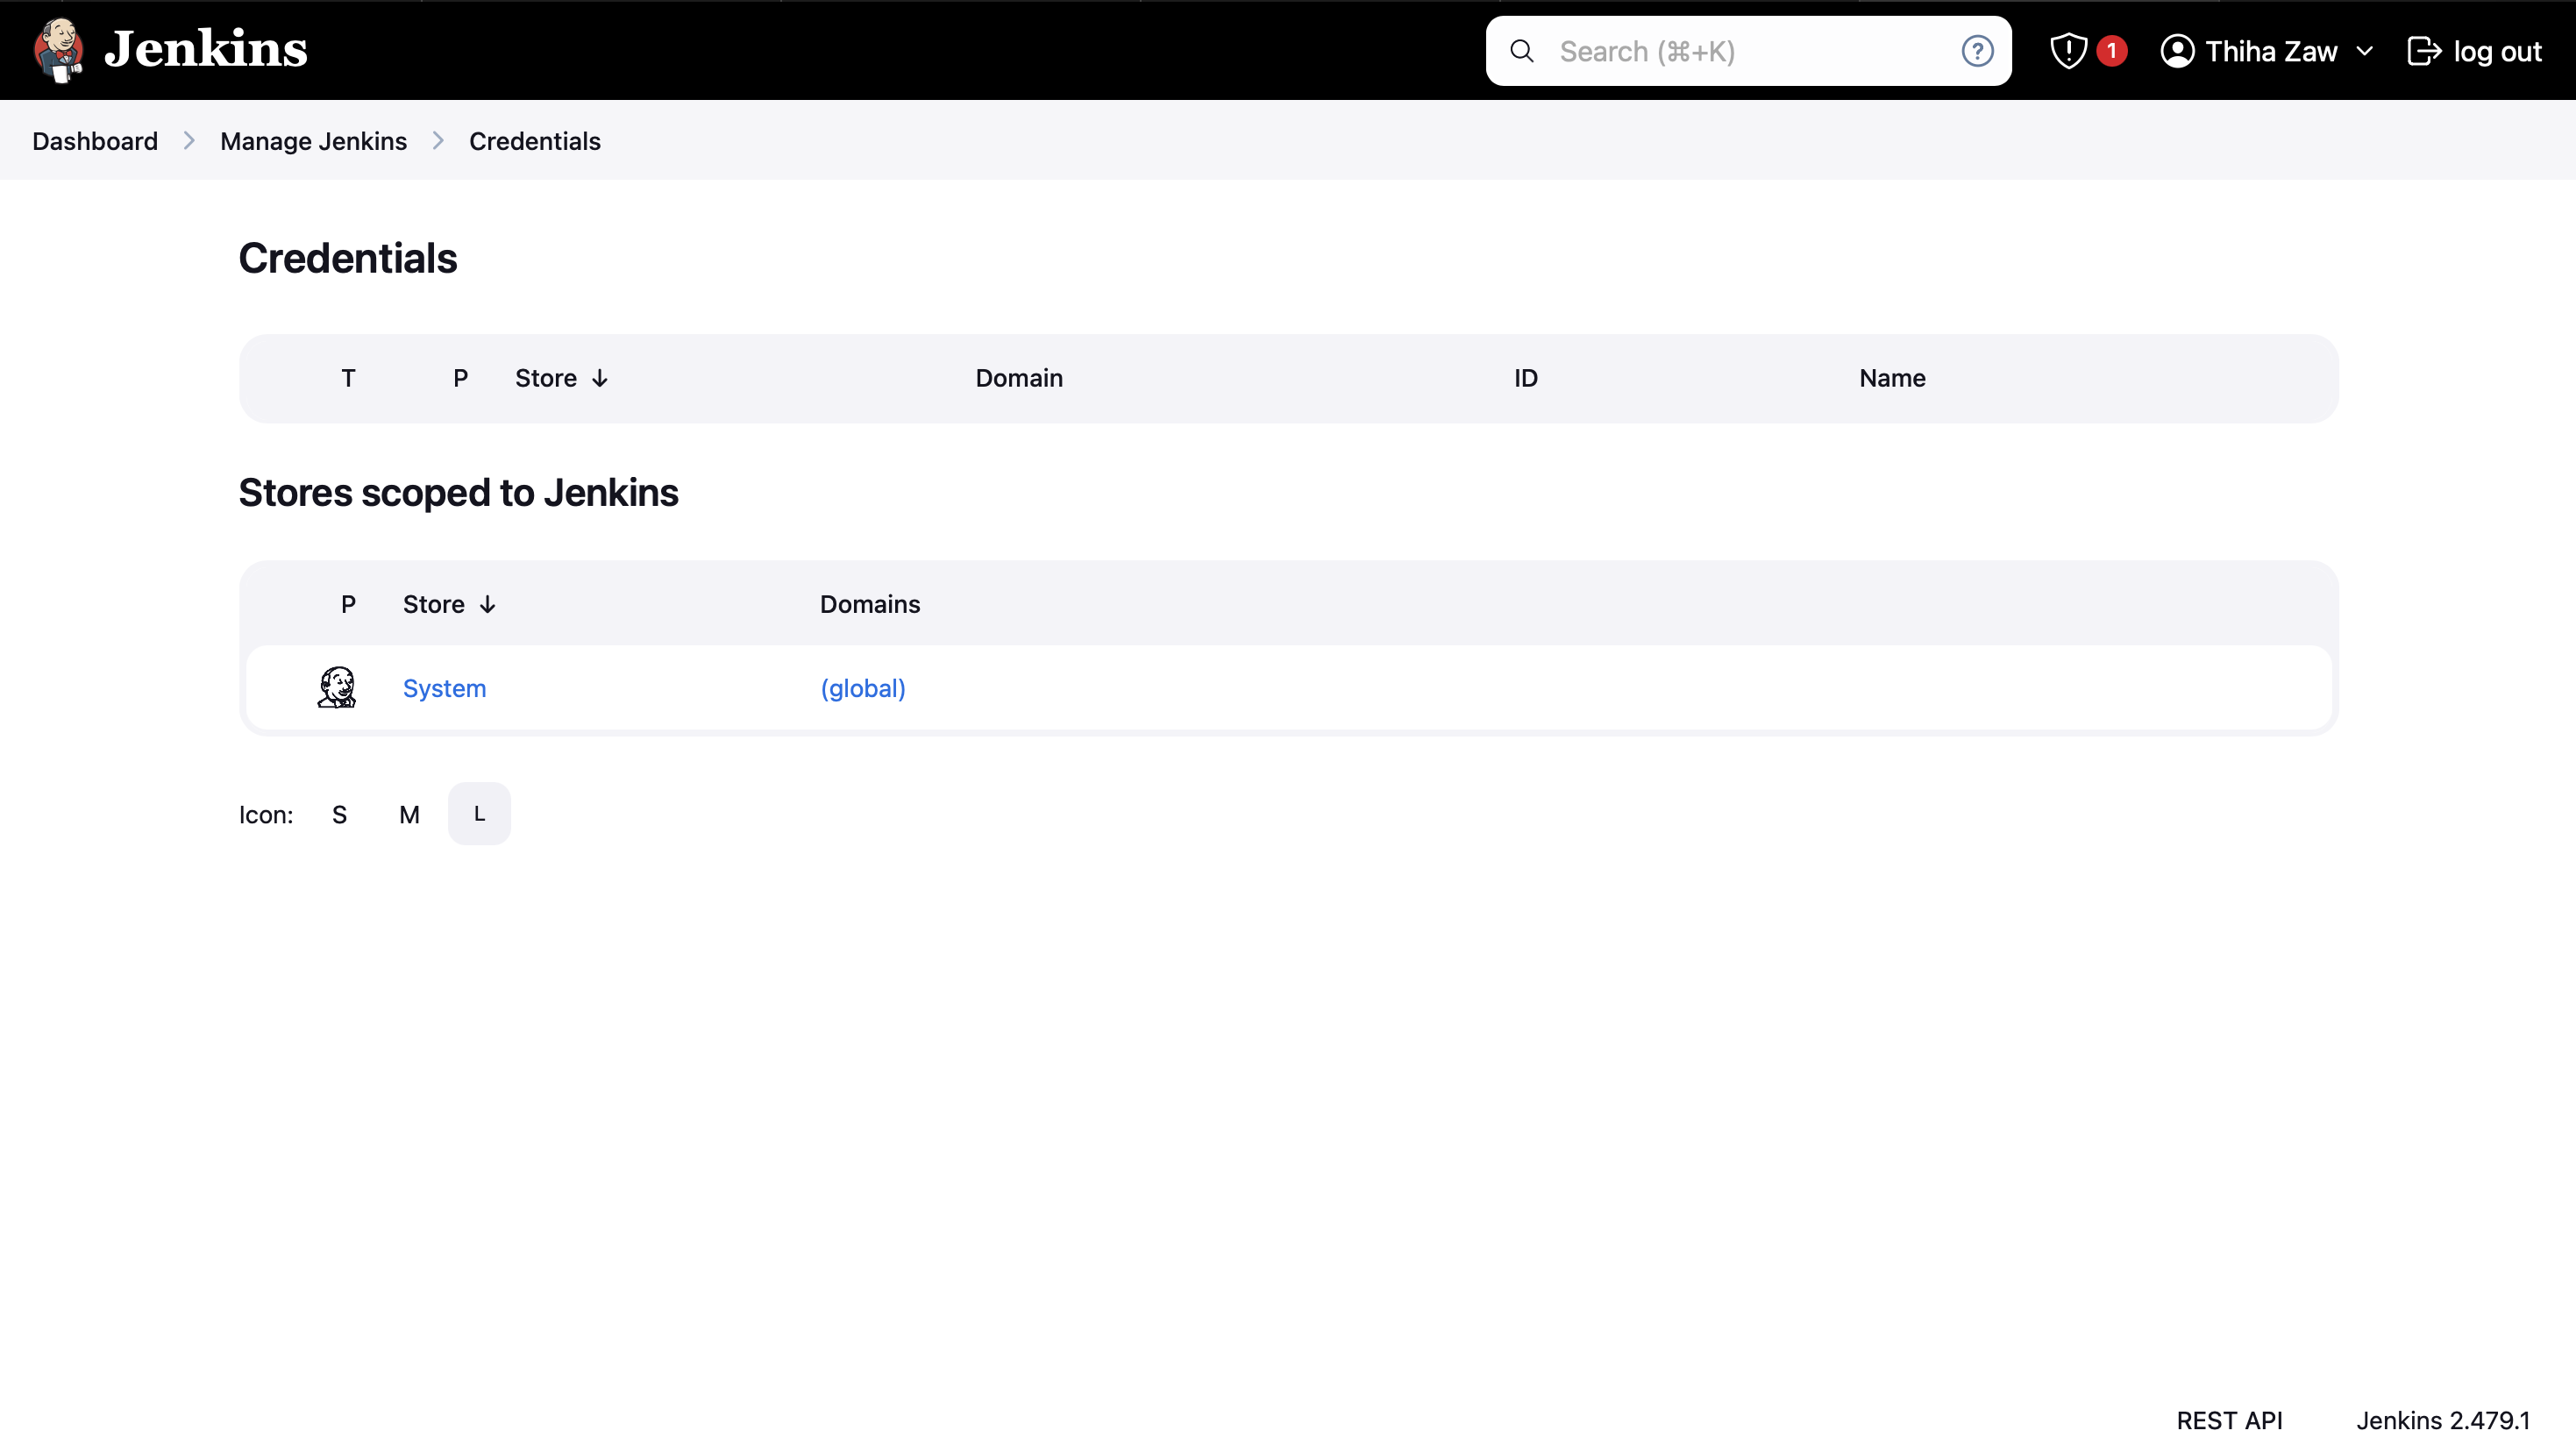
- Click on "(global)" under "Stores scoped to Jenkins"
- Click "Add Credentials"
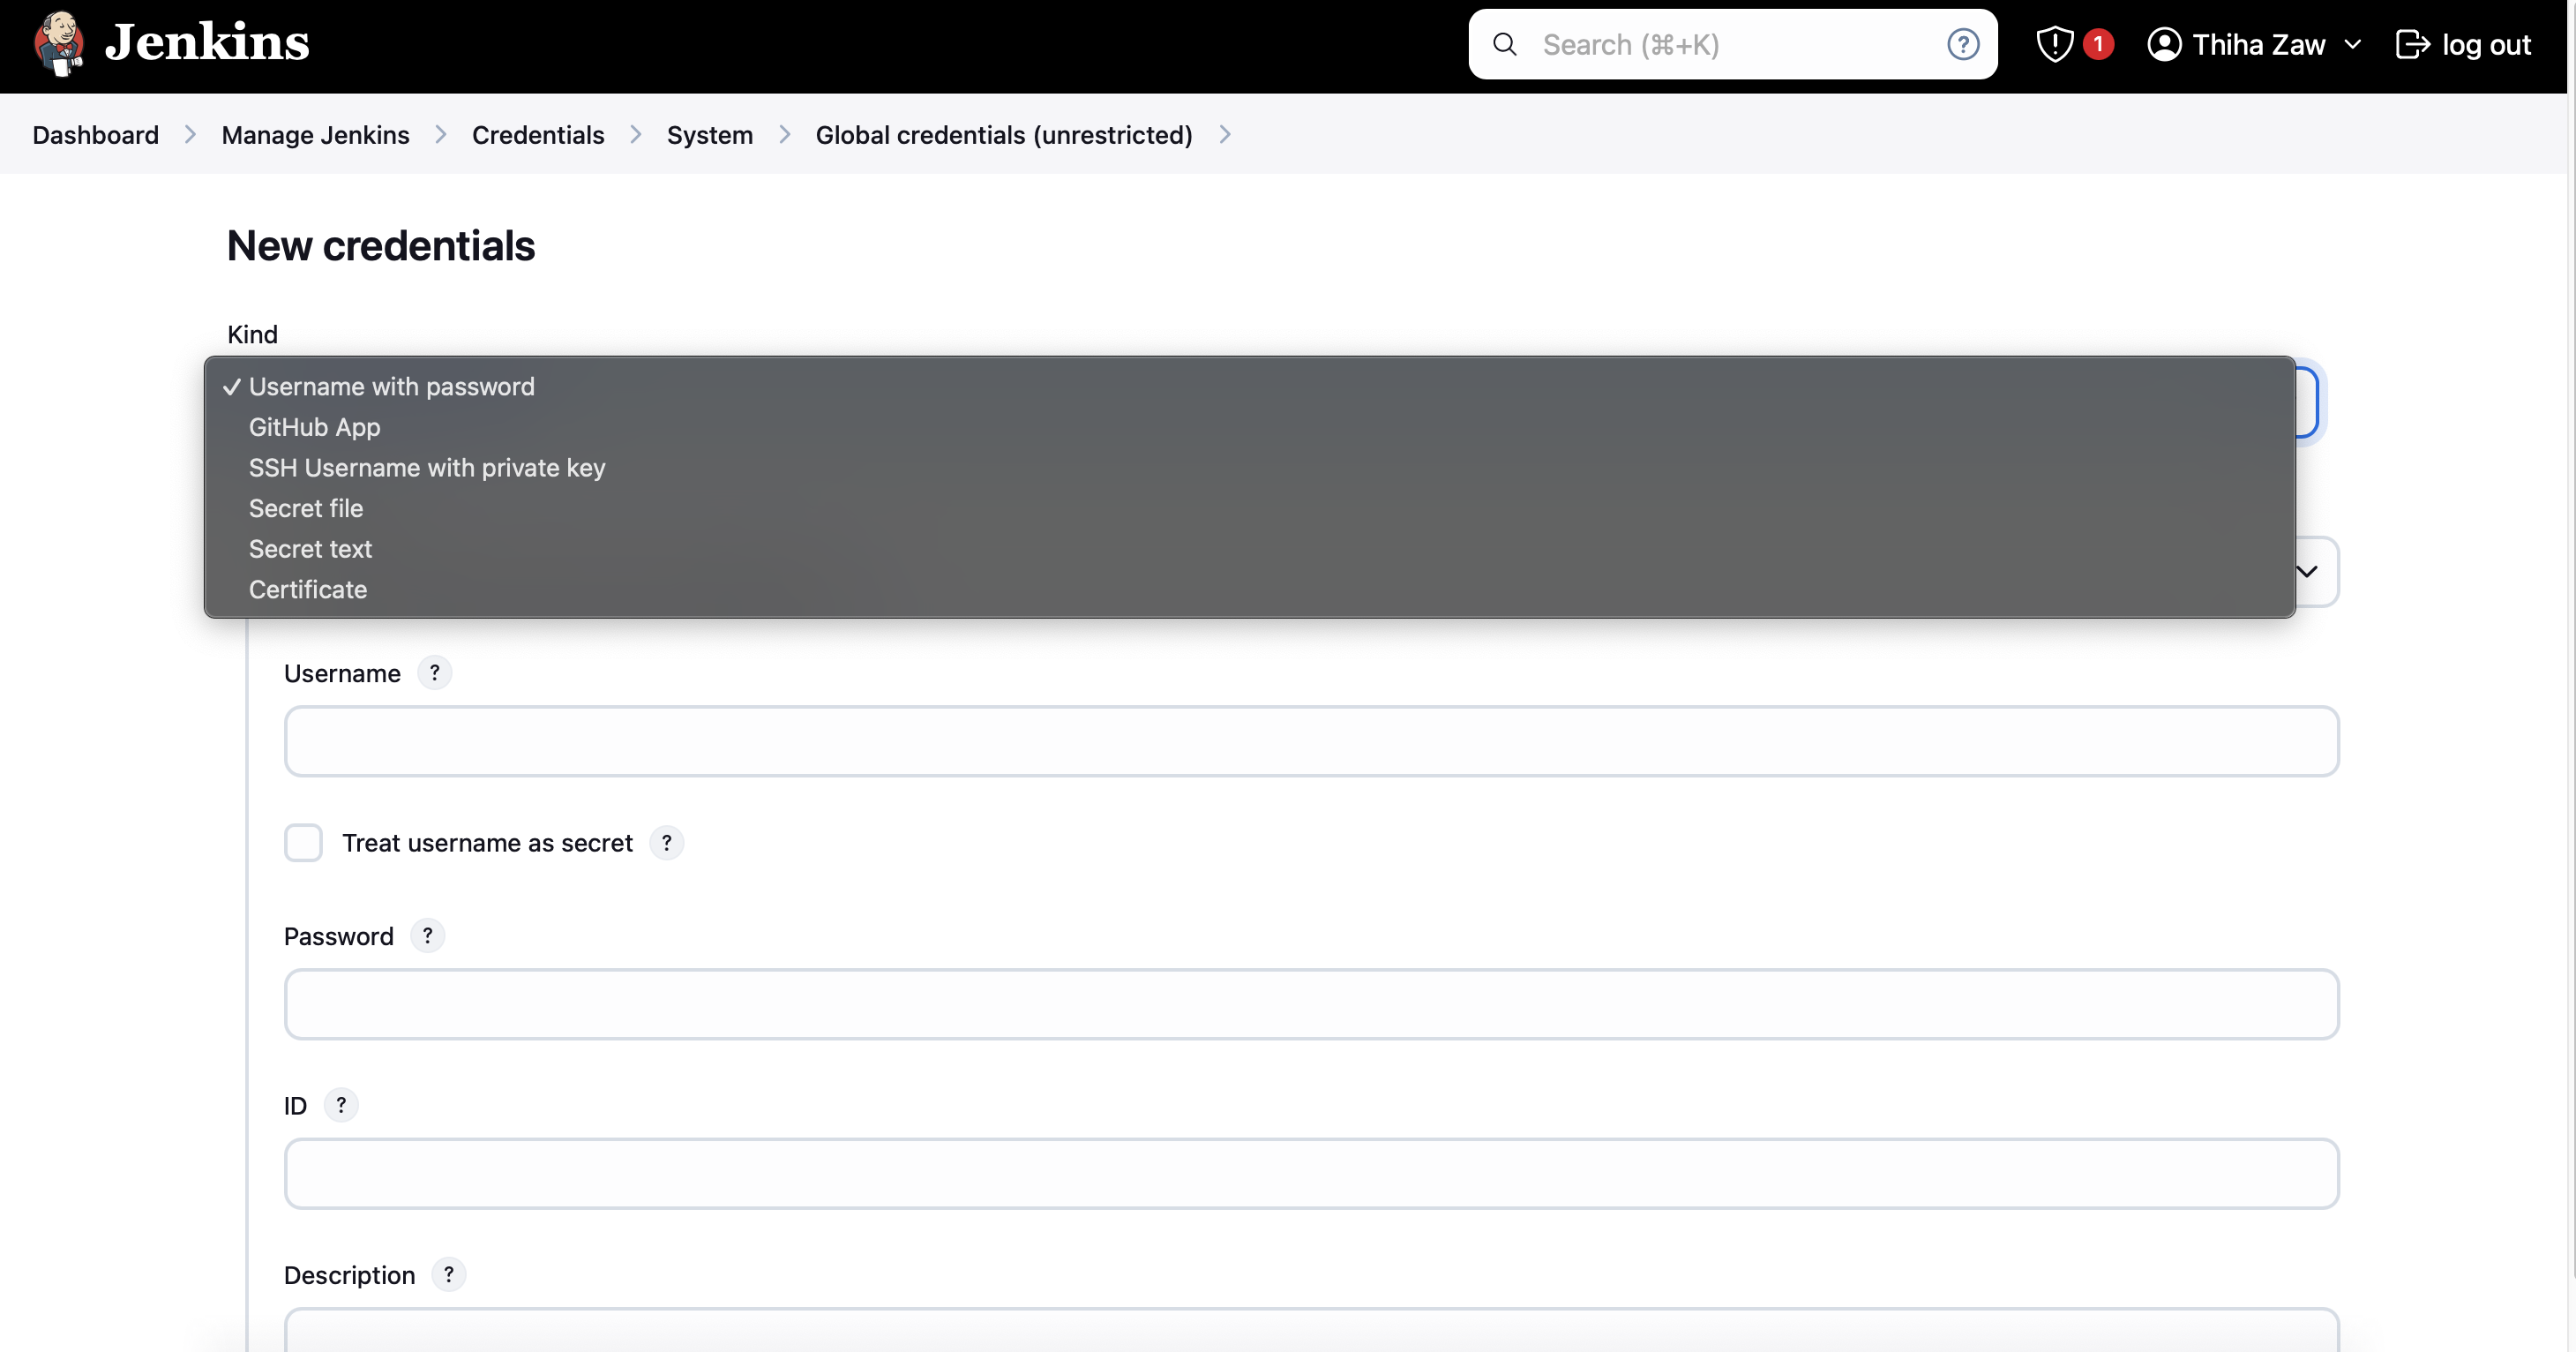
- Choose "Secret text" as the kind
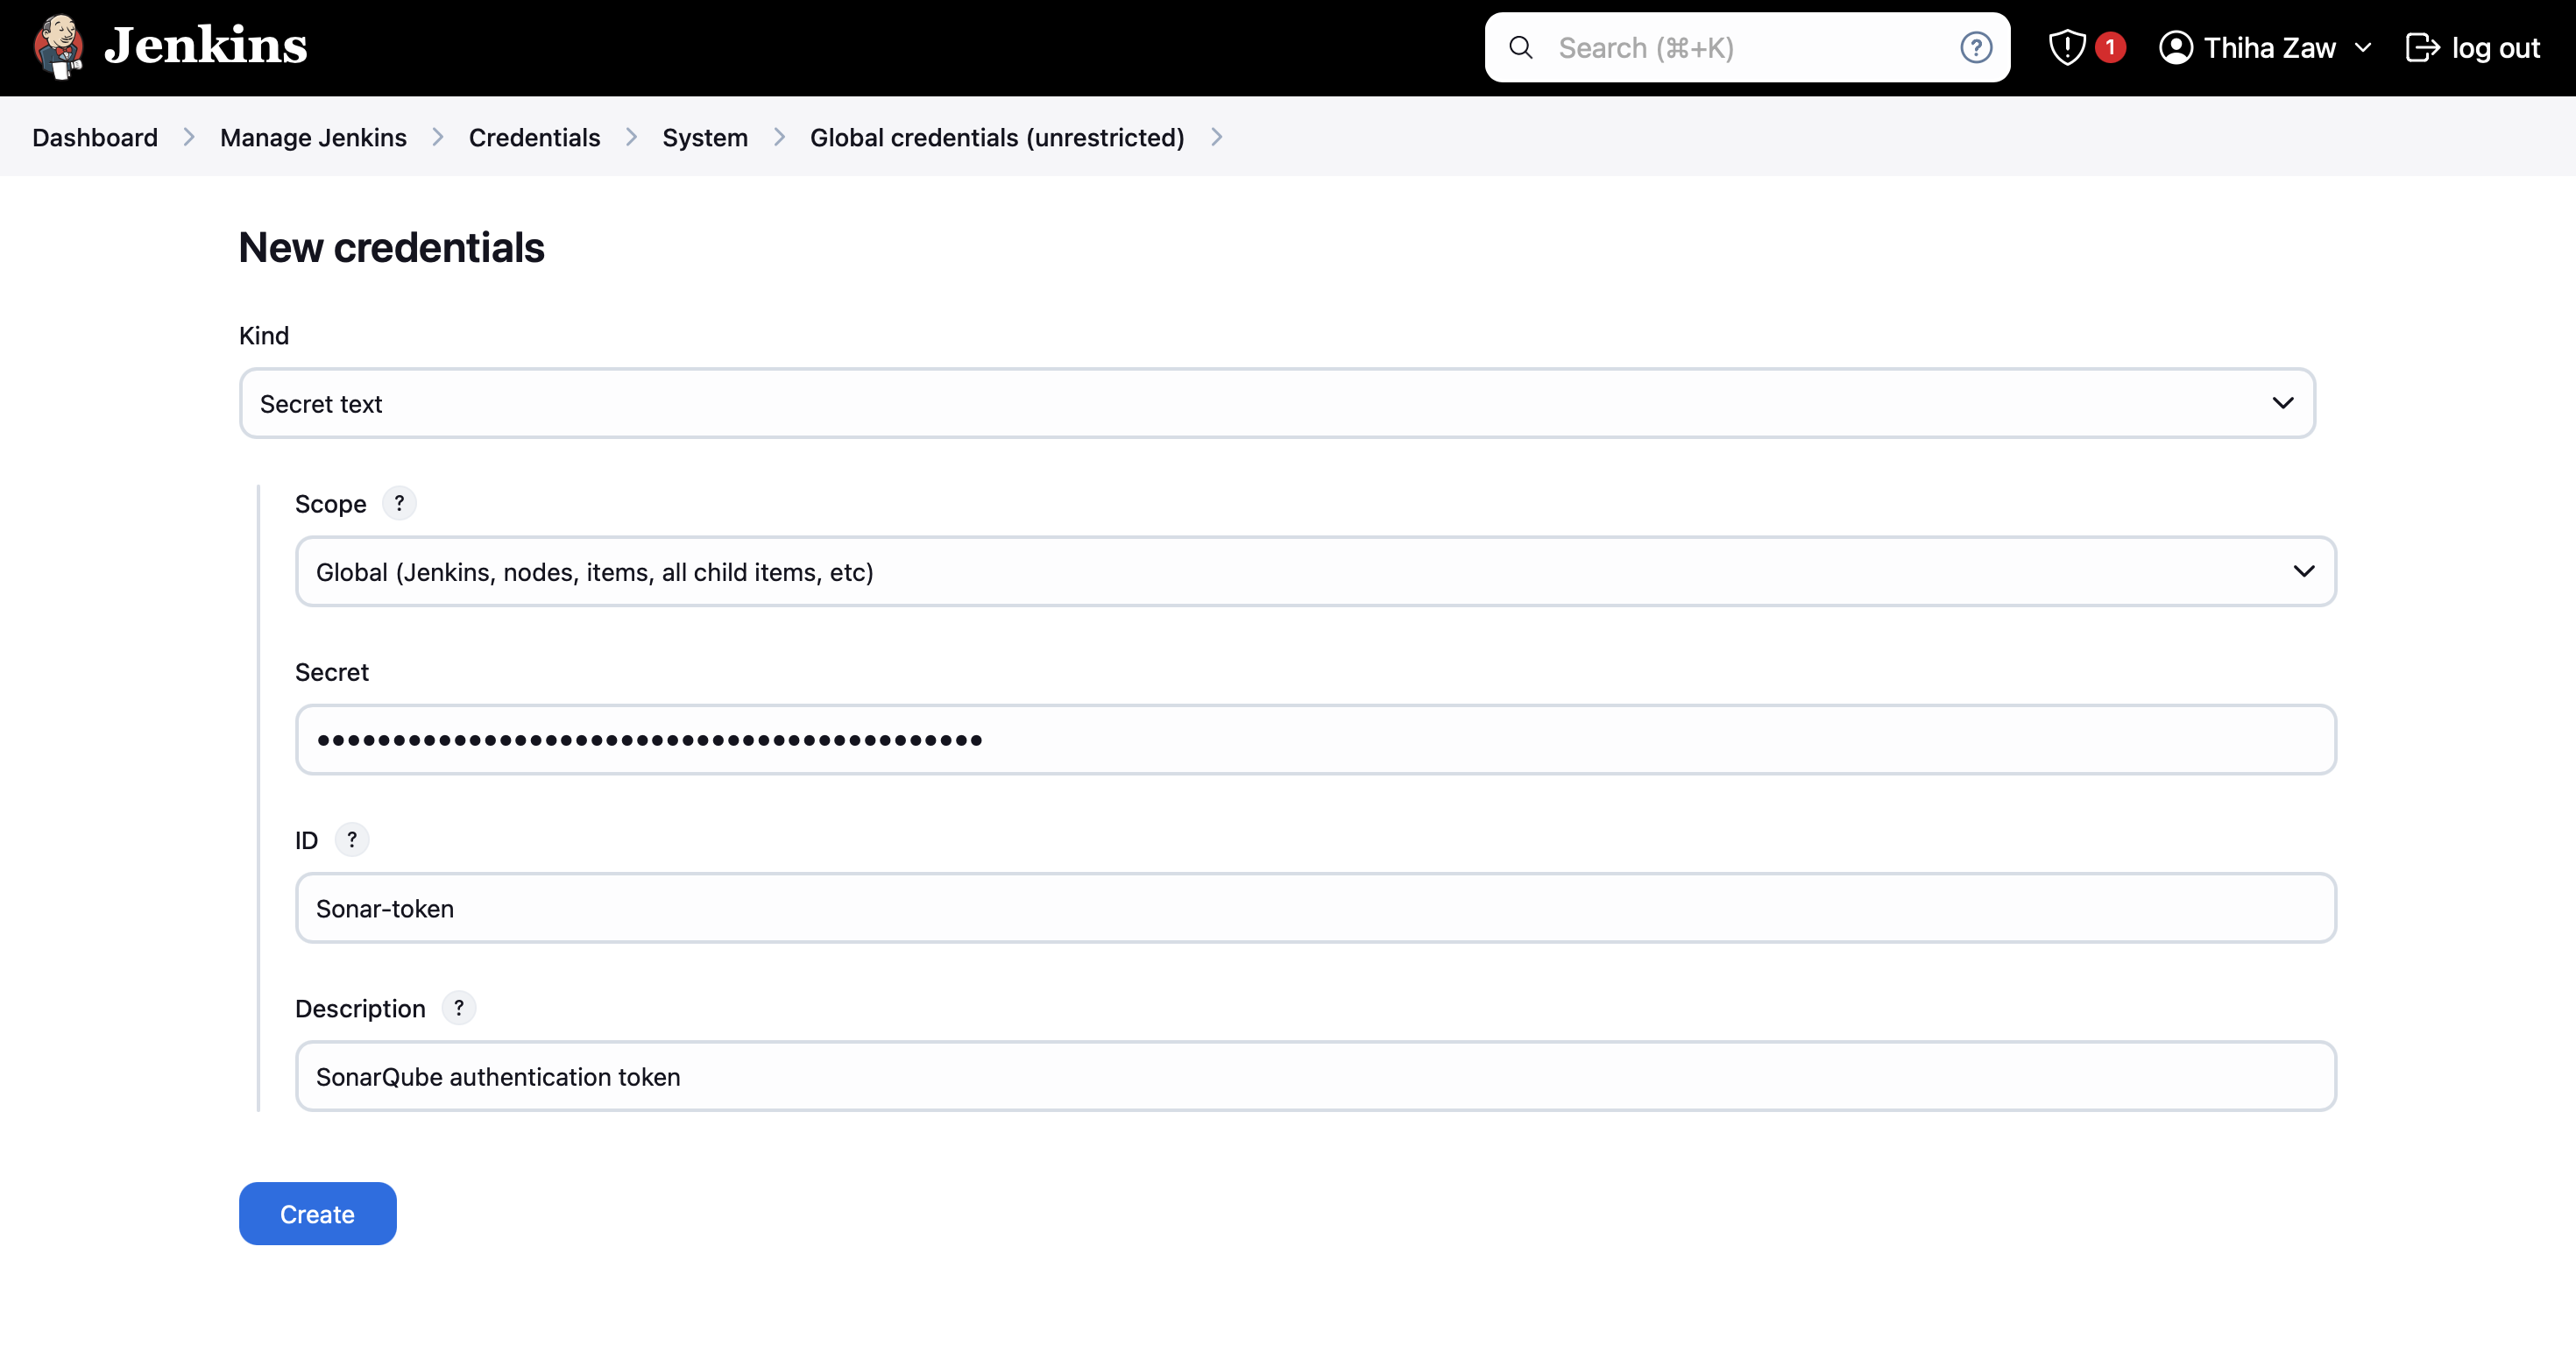
- Paste the SonarQube token in the "Secret" field
- Set the ID as "Sonar-token" (to match the pipeline script)
- Add a description (e.g., "SonarQube authentication token")
- Click "Create"
Configure SonarQube Server in Jenkins
- In Jenkins, add the SonarQube scanner plugin first. Goto Manage Jenkins > Plugins
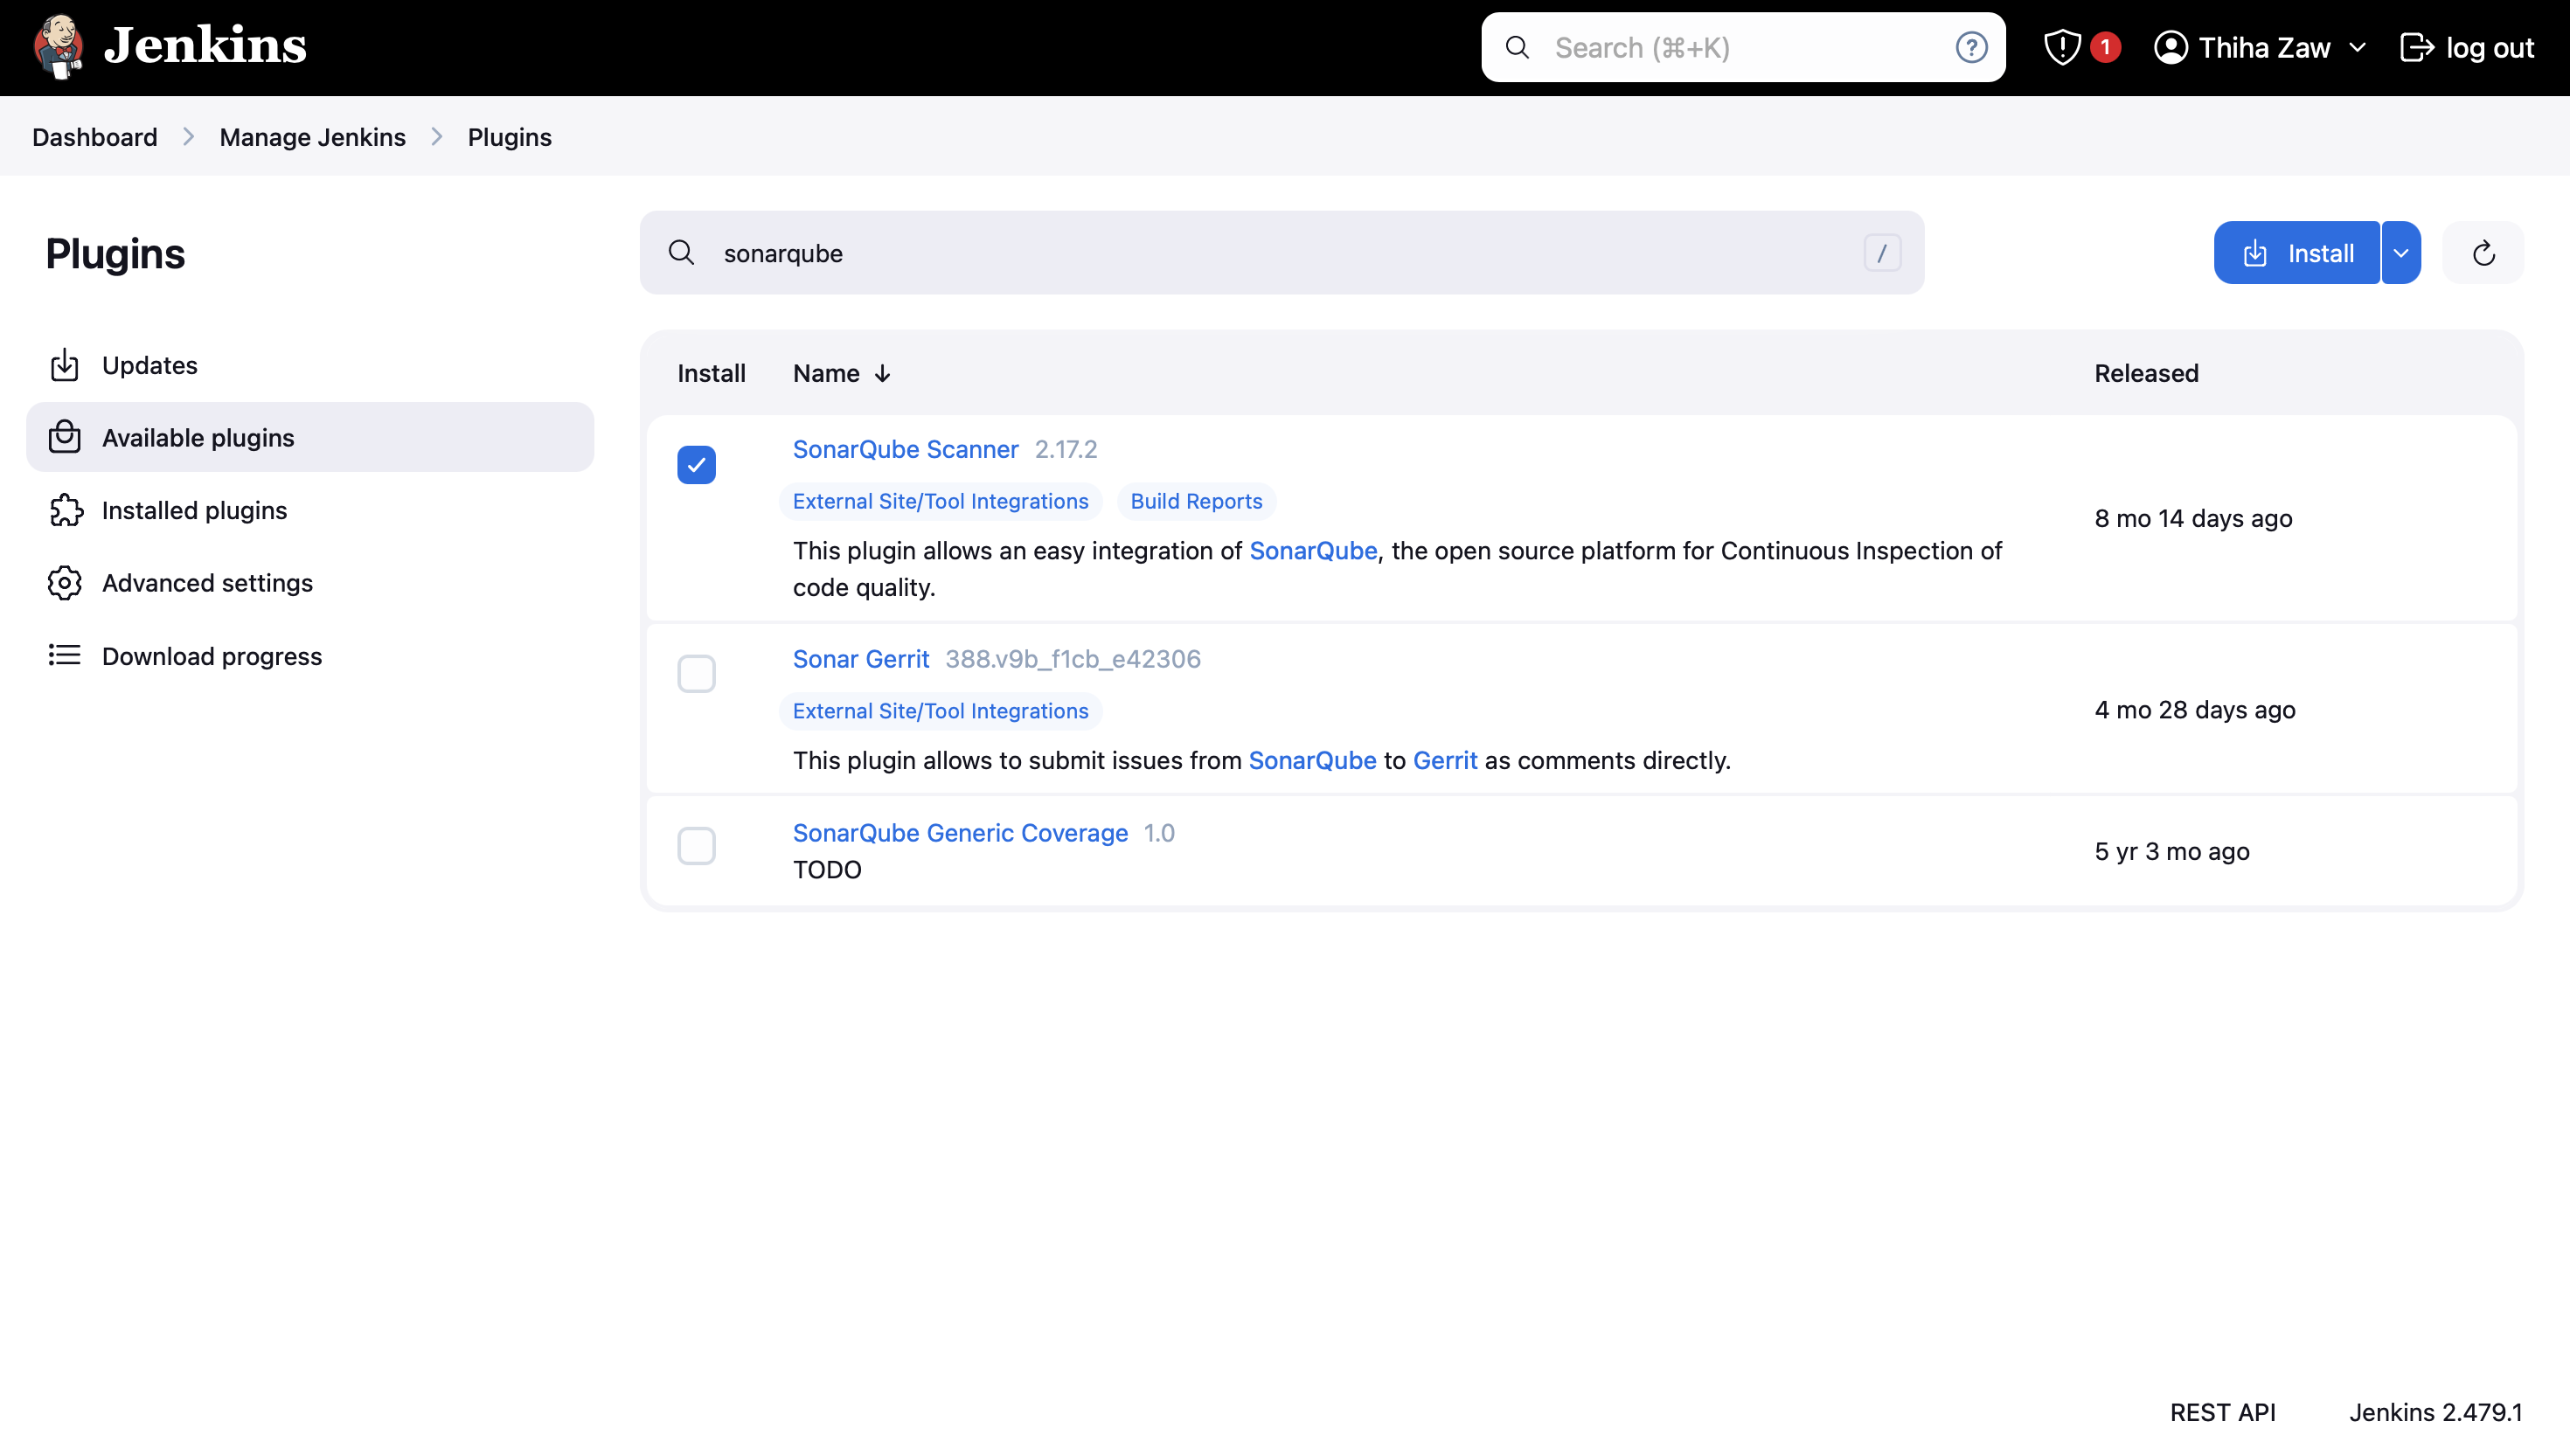
- Click on Install and Continue.
- Note: Whenever you install the new plugins scroll down to the bottom and then click on this box for auto restart the Jenkins Server.

- Then install the Sonar-Qube Scanner. To do so, goto Manage Jenkins > Tools.
- Search for Sonar-Qube Scanner installations.
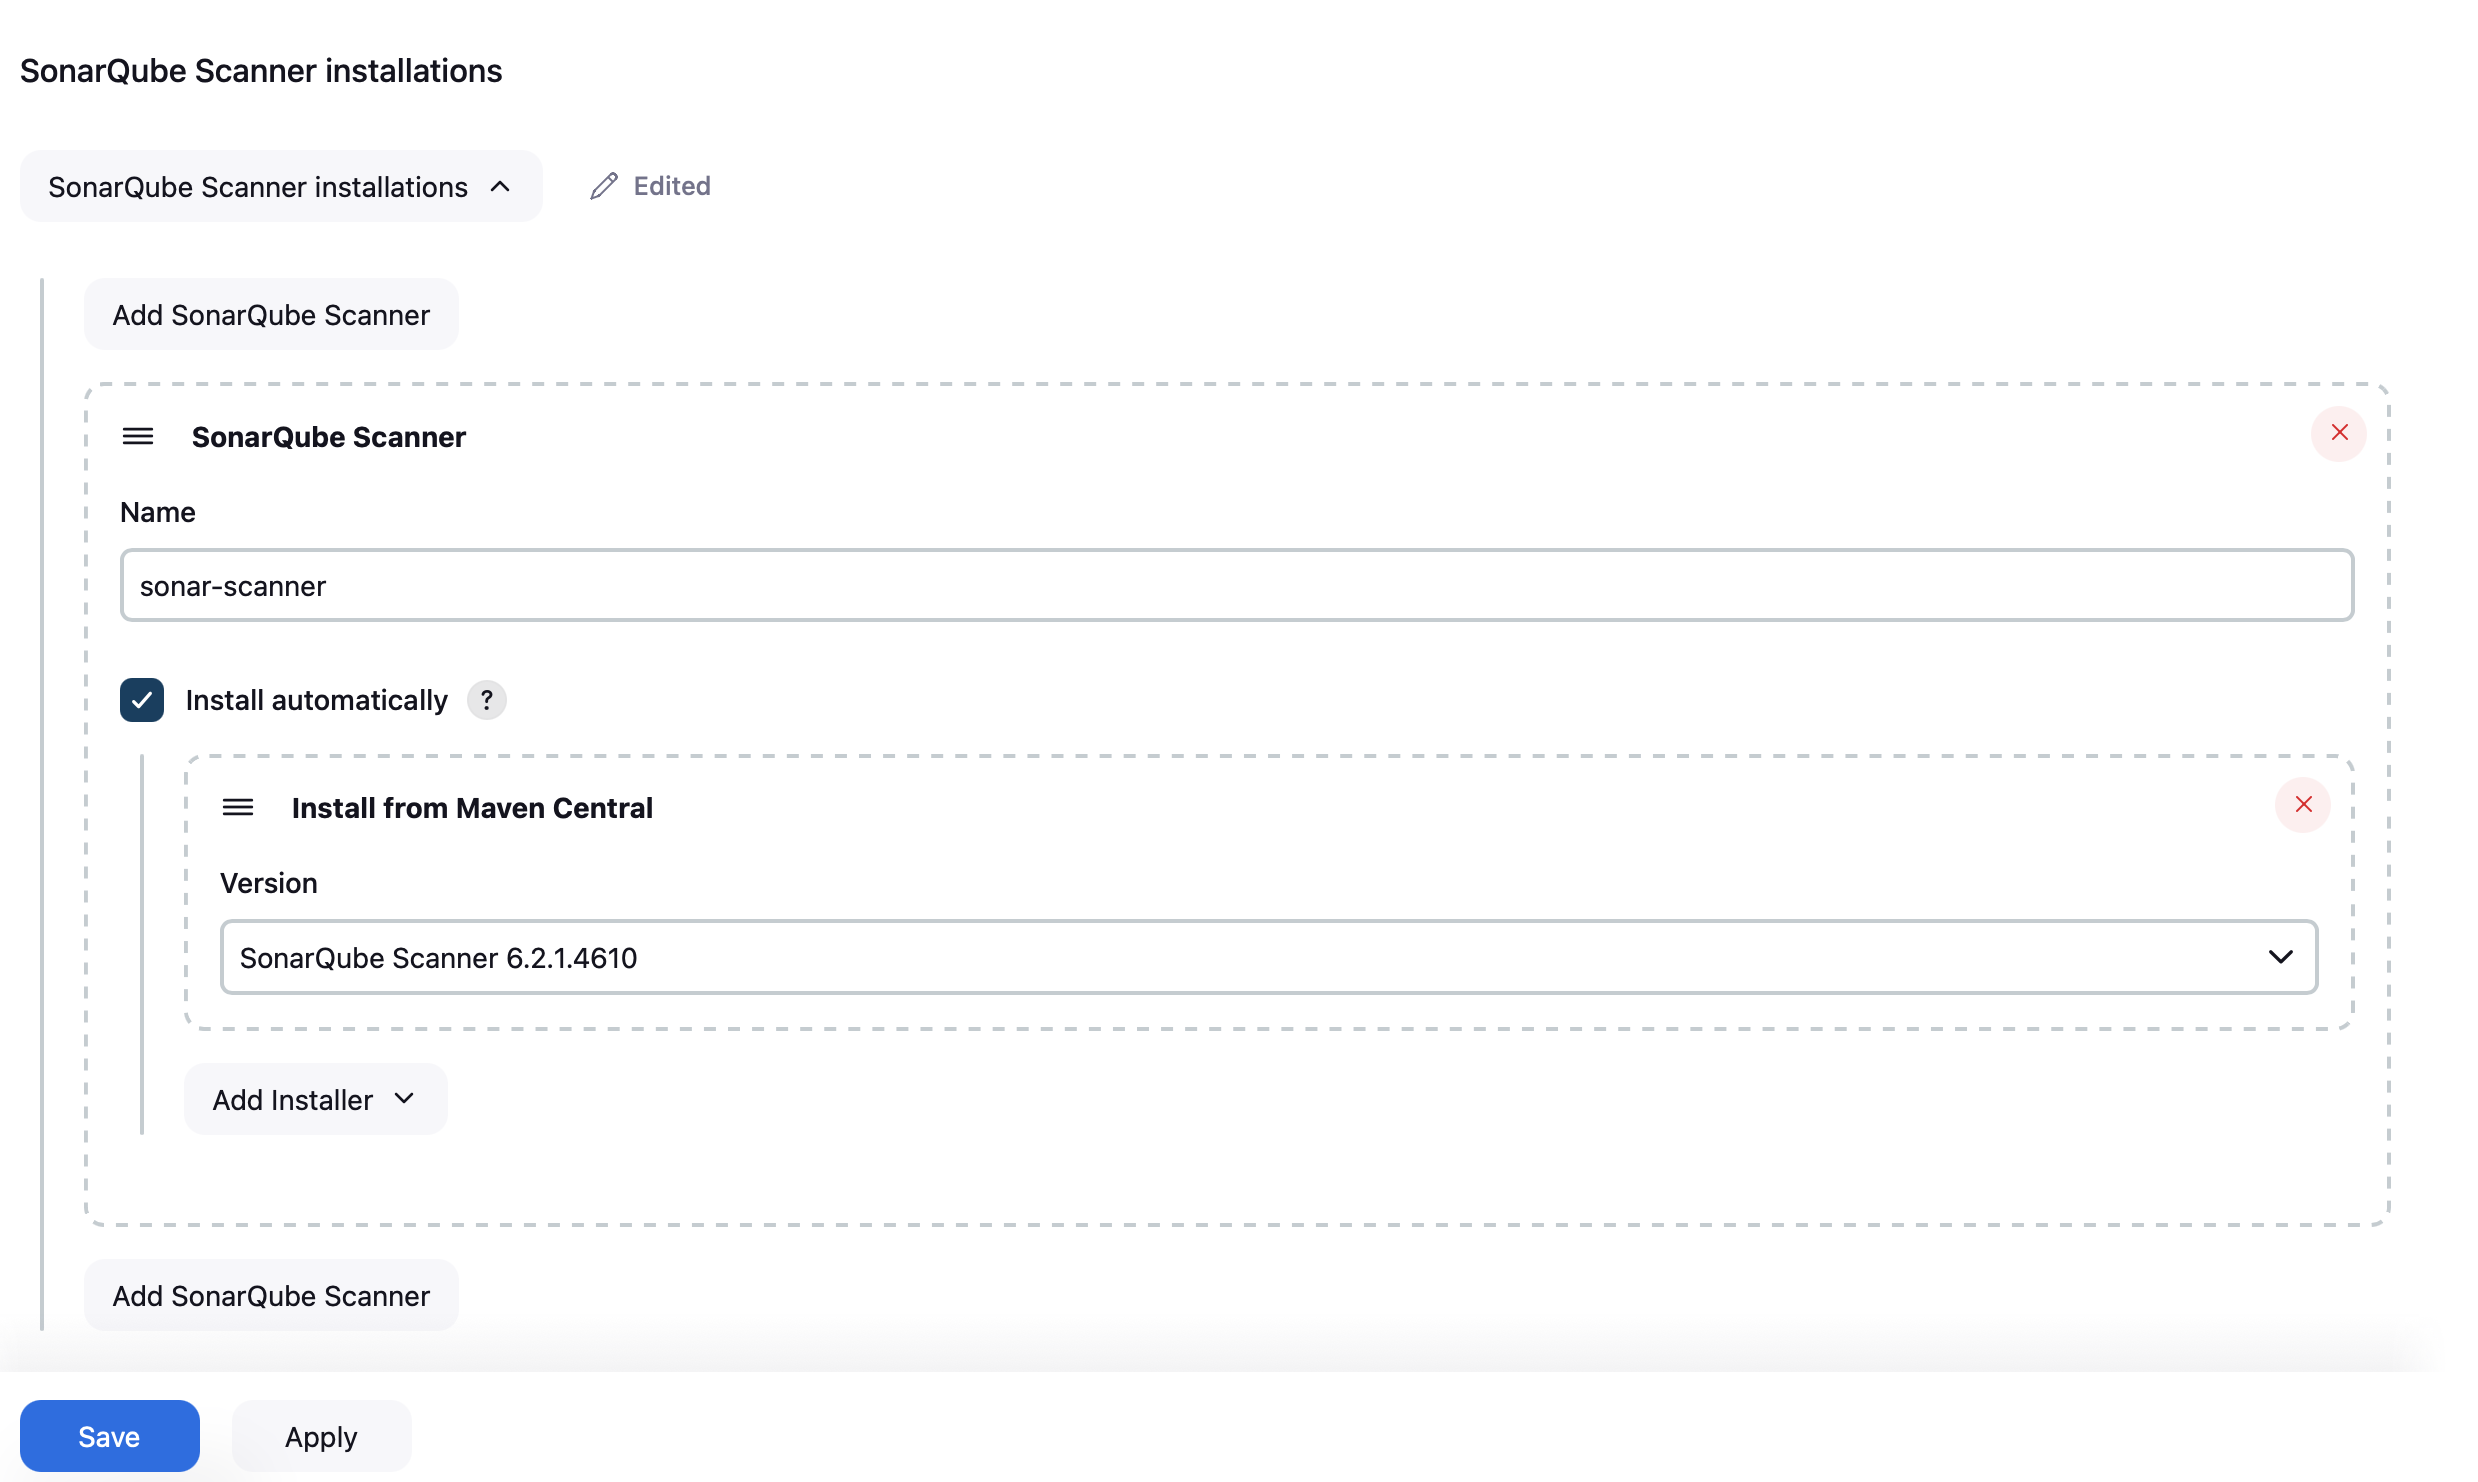
- Click Save. After that, go to Manage Jenkins > Configure System
- Find the SonarQube servers section
- Click "Add SonarQube"
- Set a name (e.g., "sonar-server" to match the pipeline script)
- Enter the SonarQube server URL (http://[your-server-ip]:9000)
- For the server authentication token, select the credentials you just created
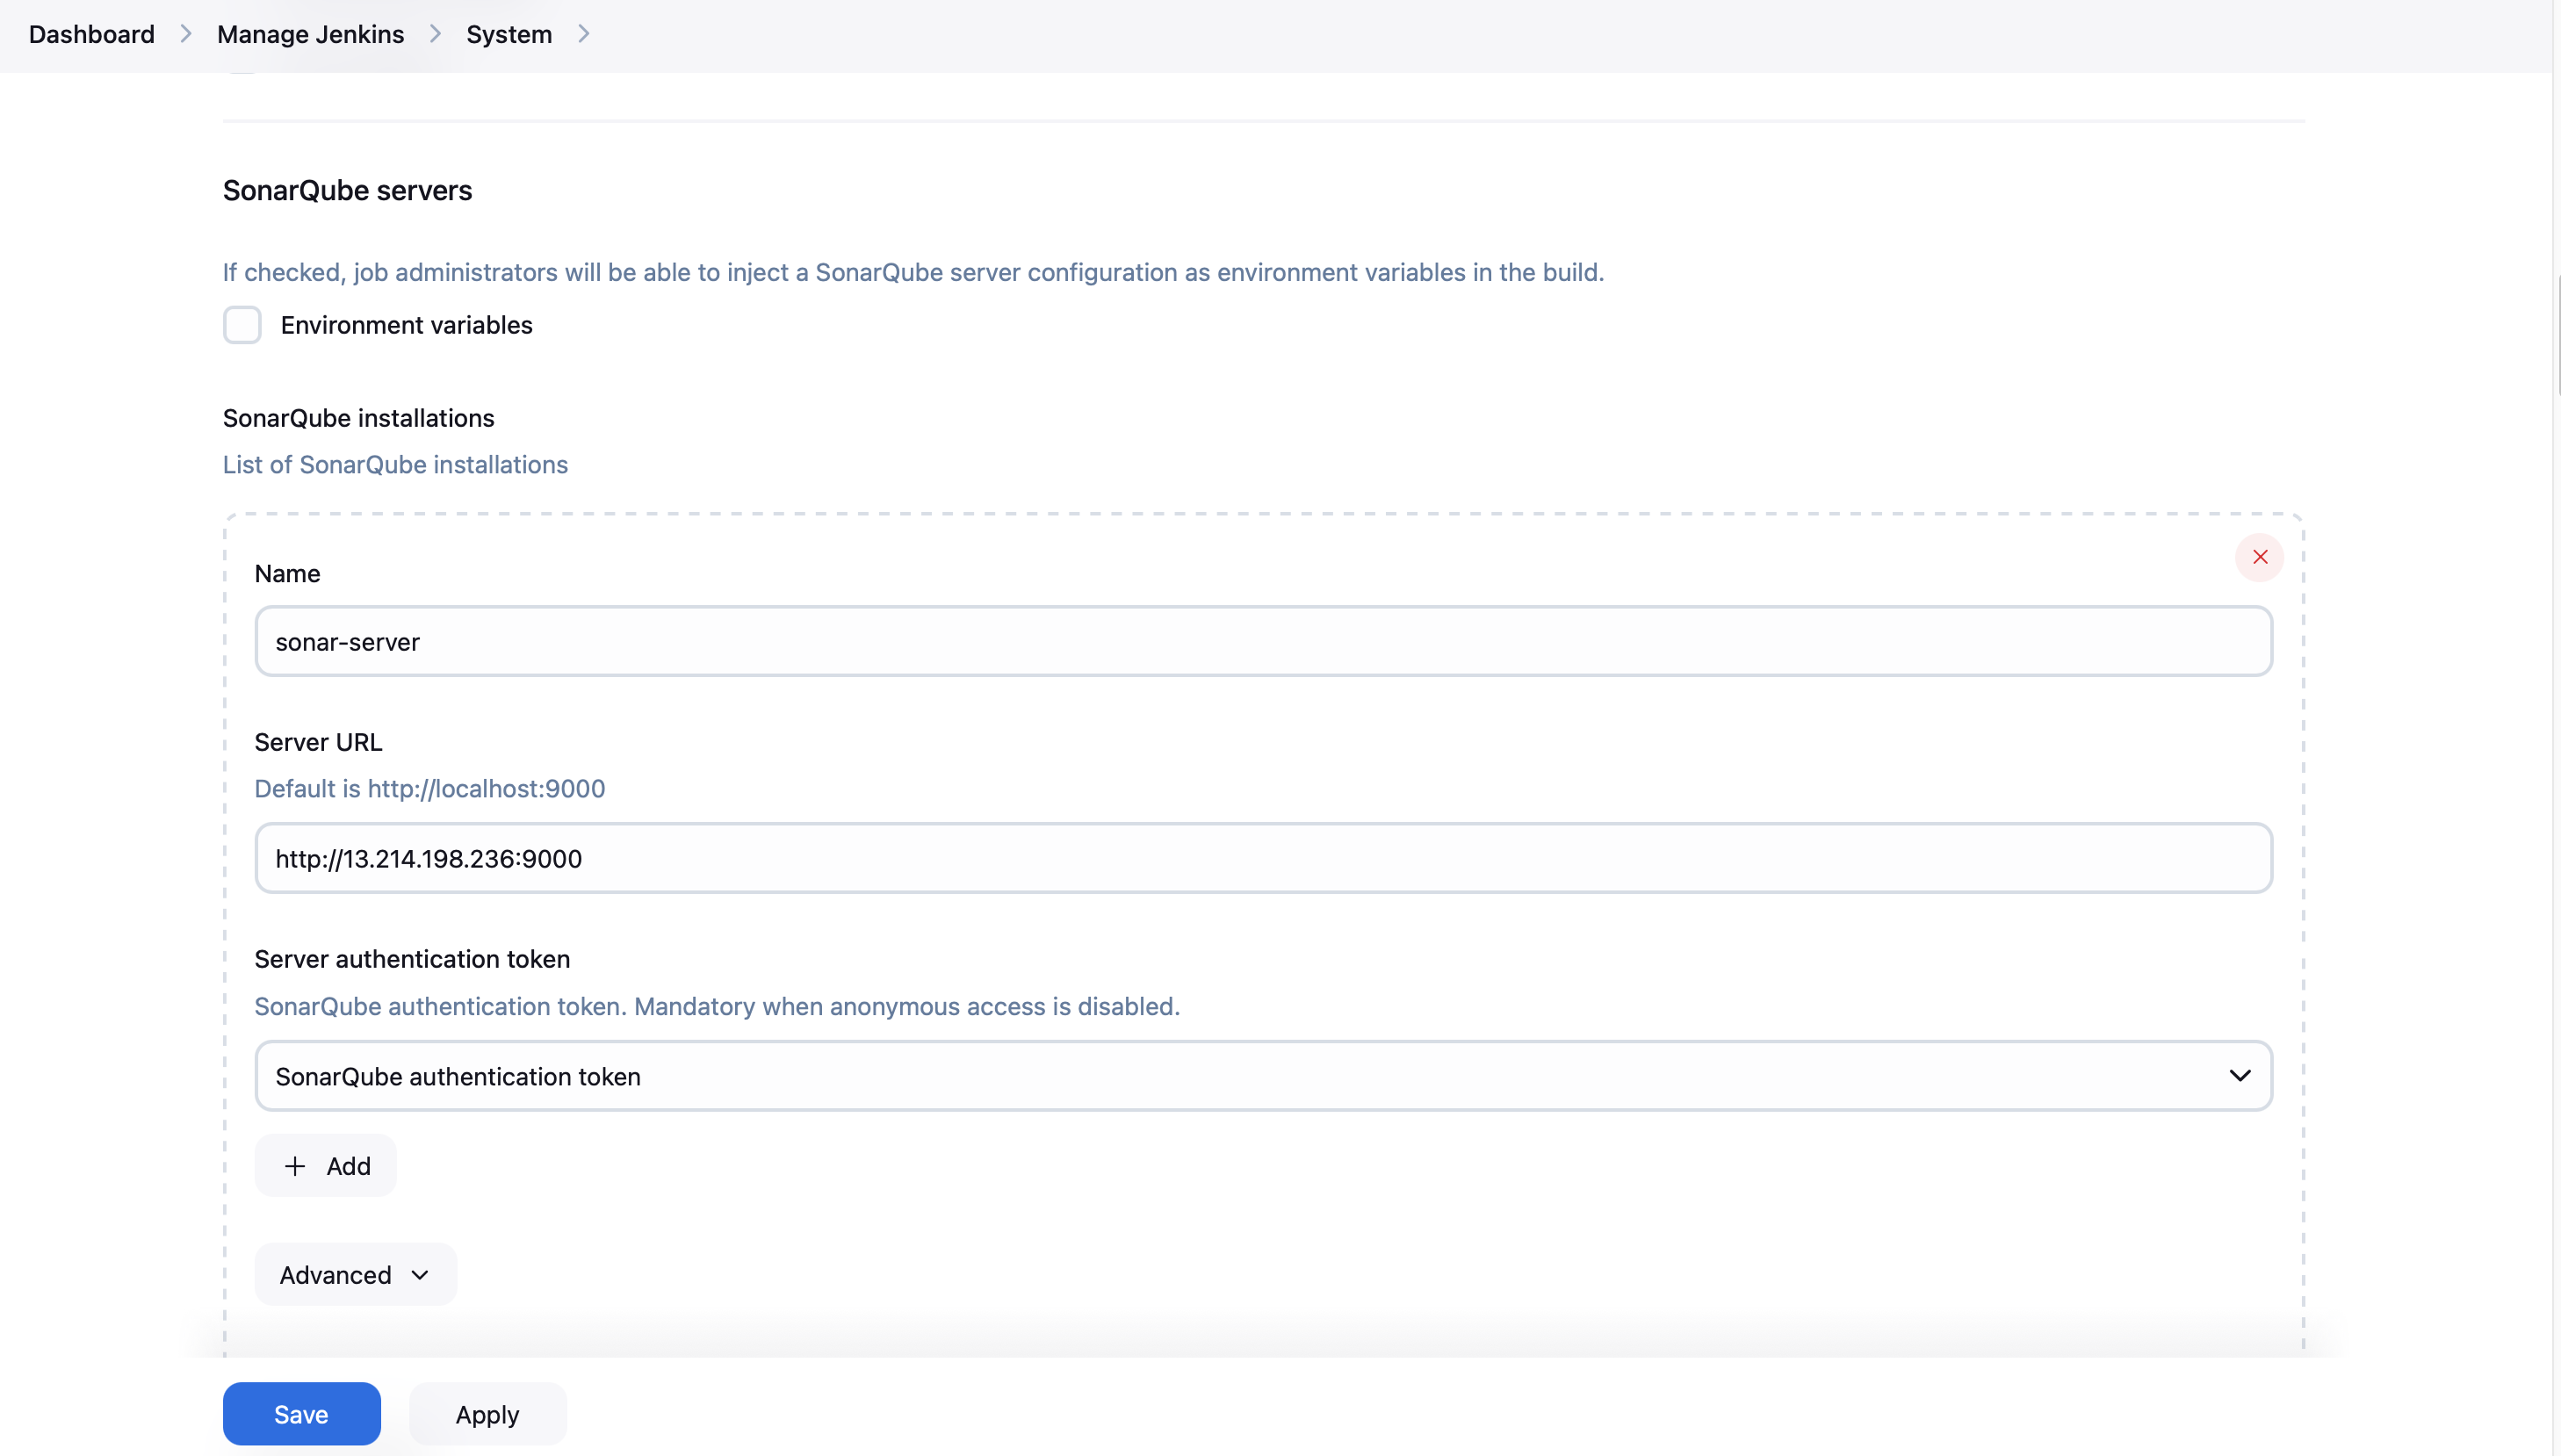
- Click "Save"
Create Webhook in SonarQube for Jenkins
- Log back into your SonarQube server
- Go to Administration > Configuration > Webhooks
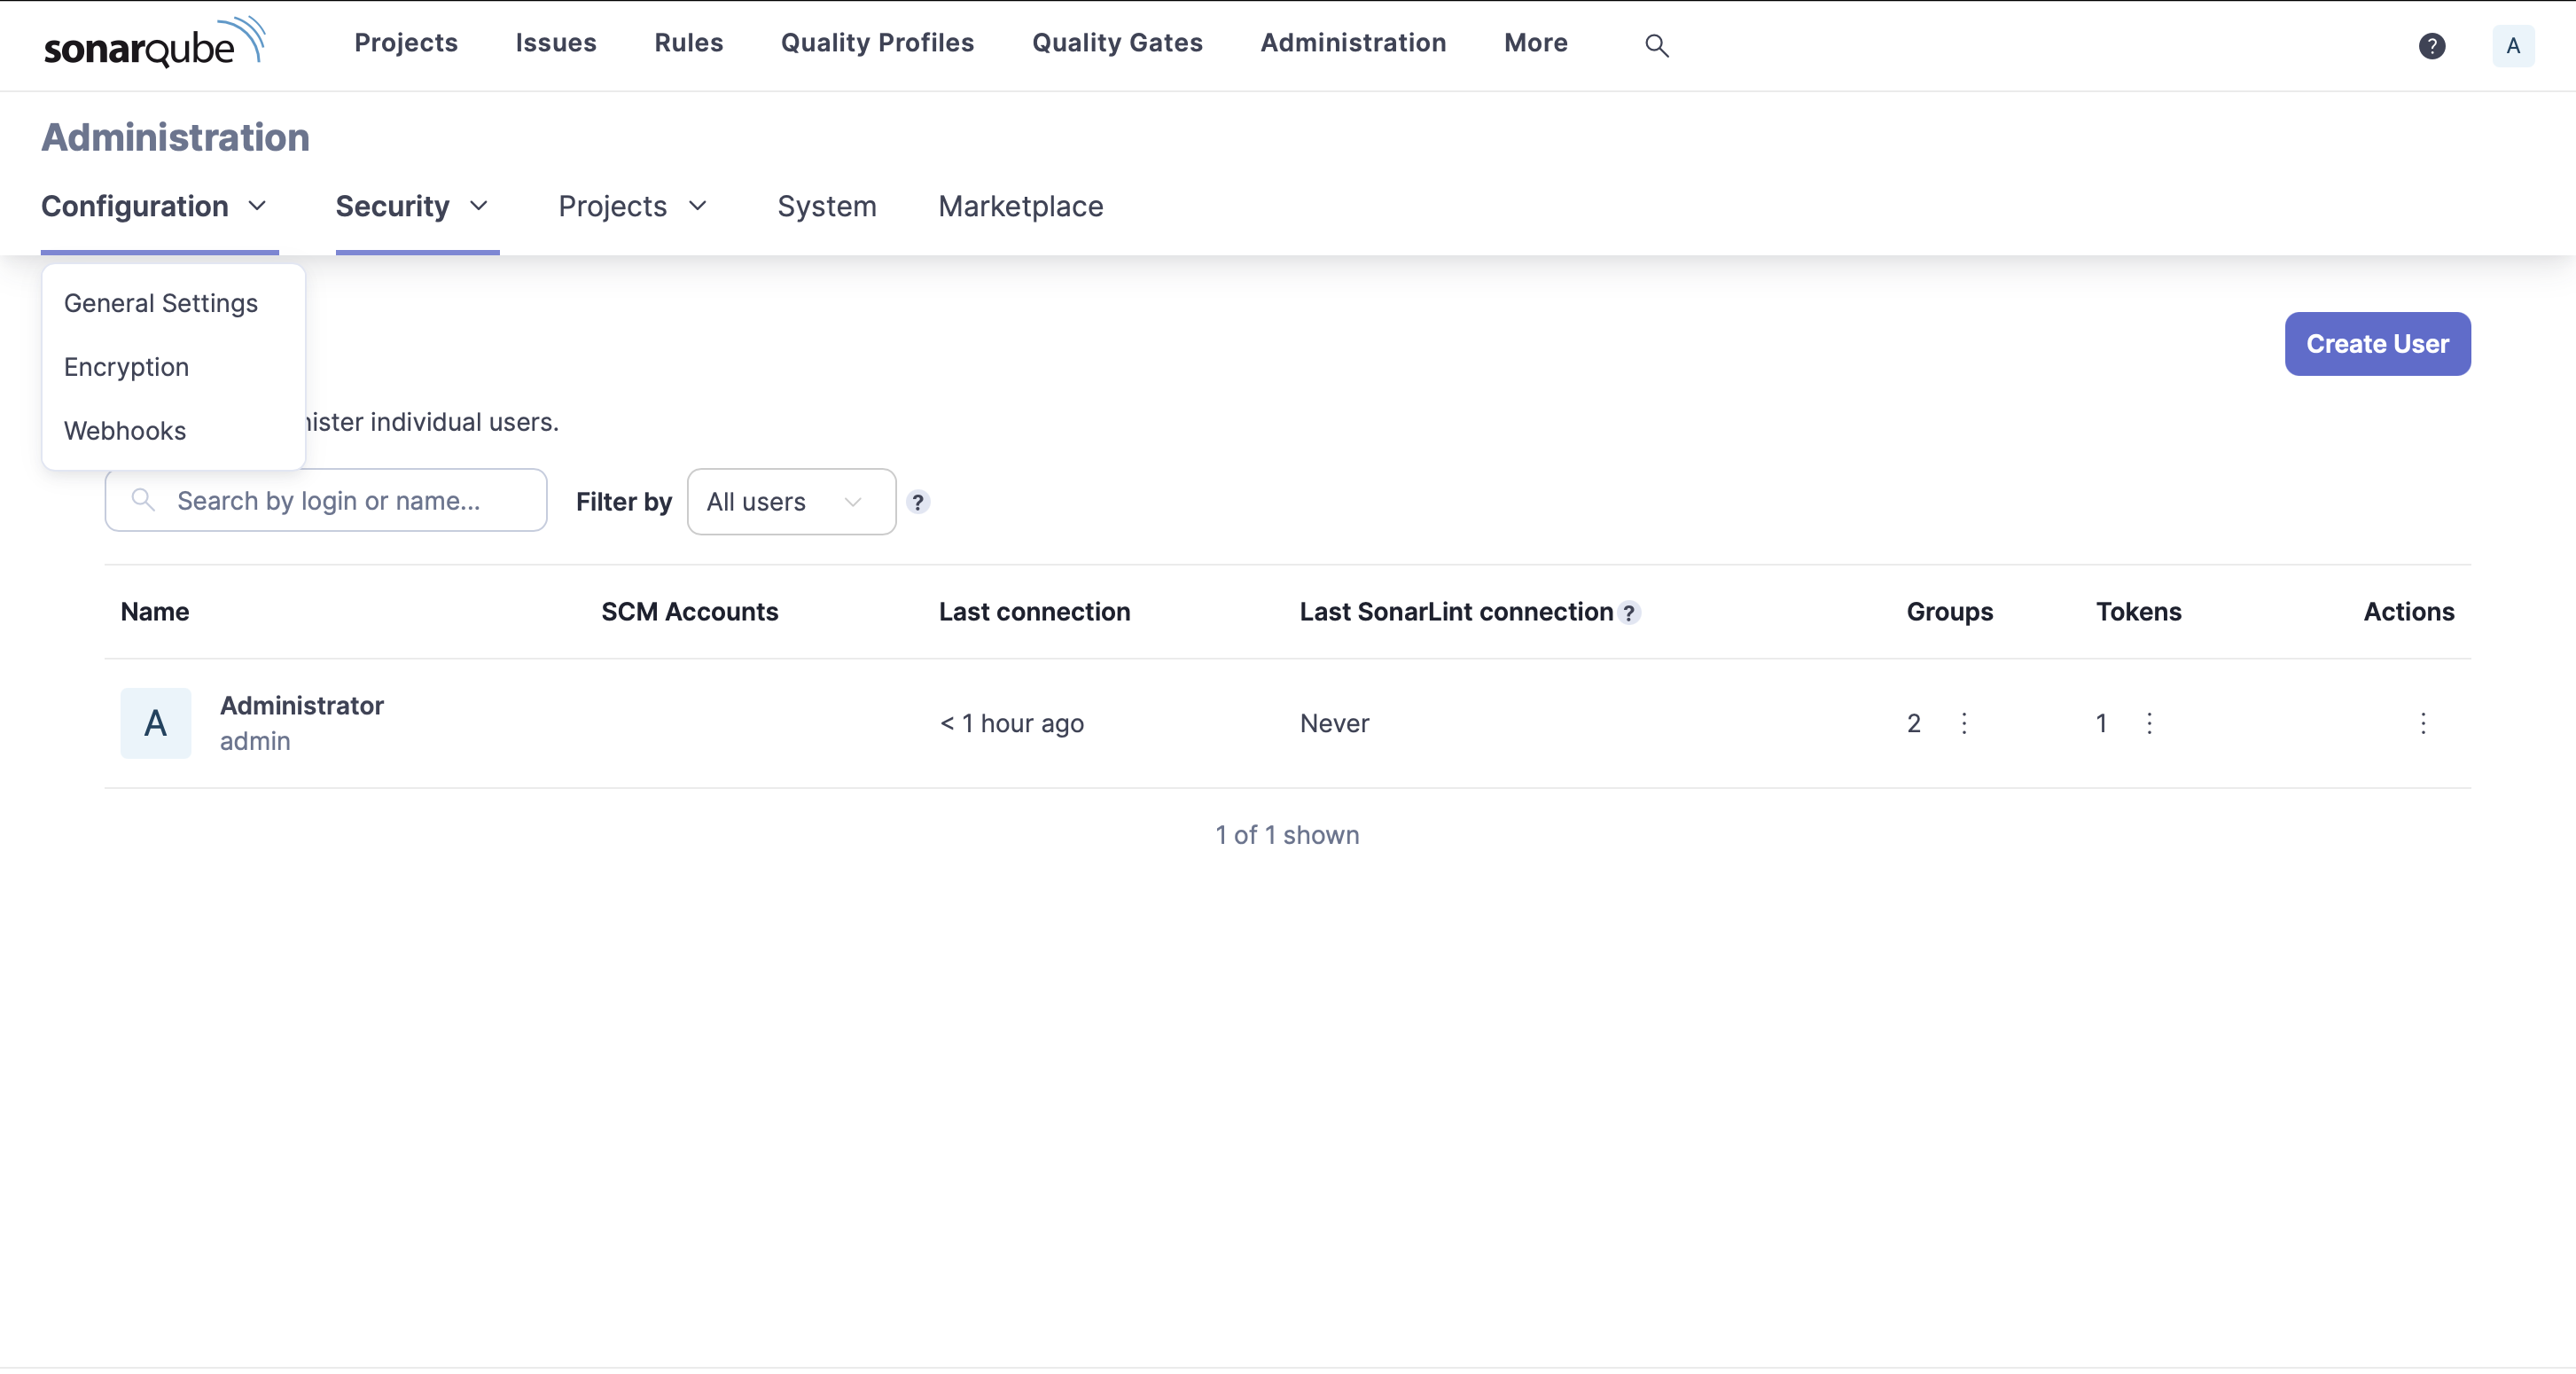
- Click "Create"
- Set a name for the webhook (e.g., "Jenkins webhook")
- For the URL, enter: http://[jenkins-server-ip]:8080/sonarqube-webhook/
- Leave the secret field blank
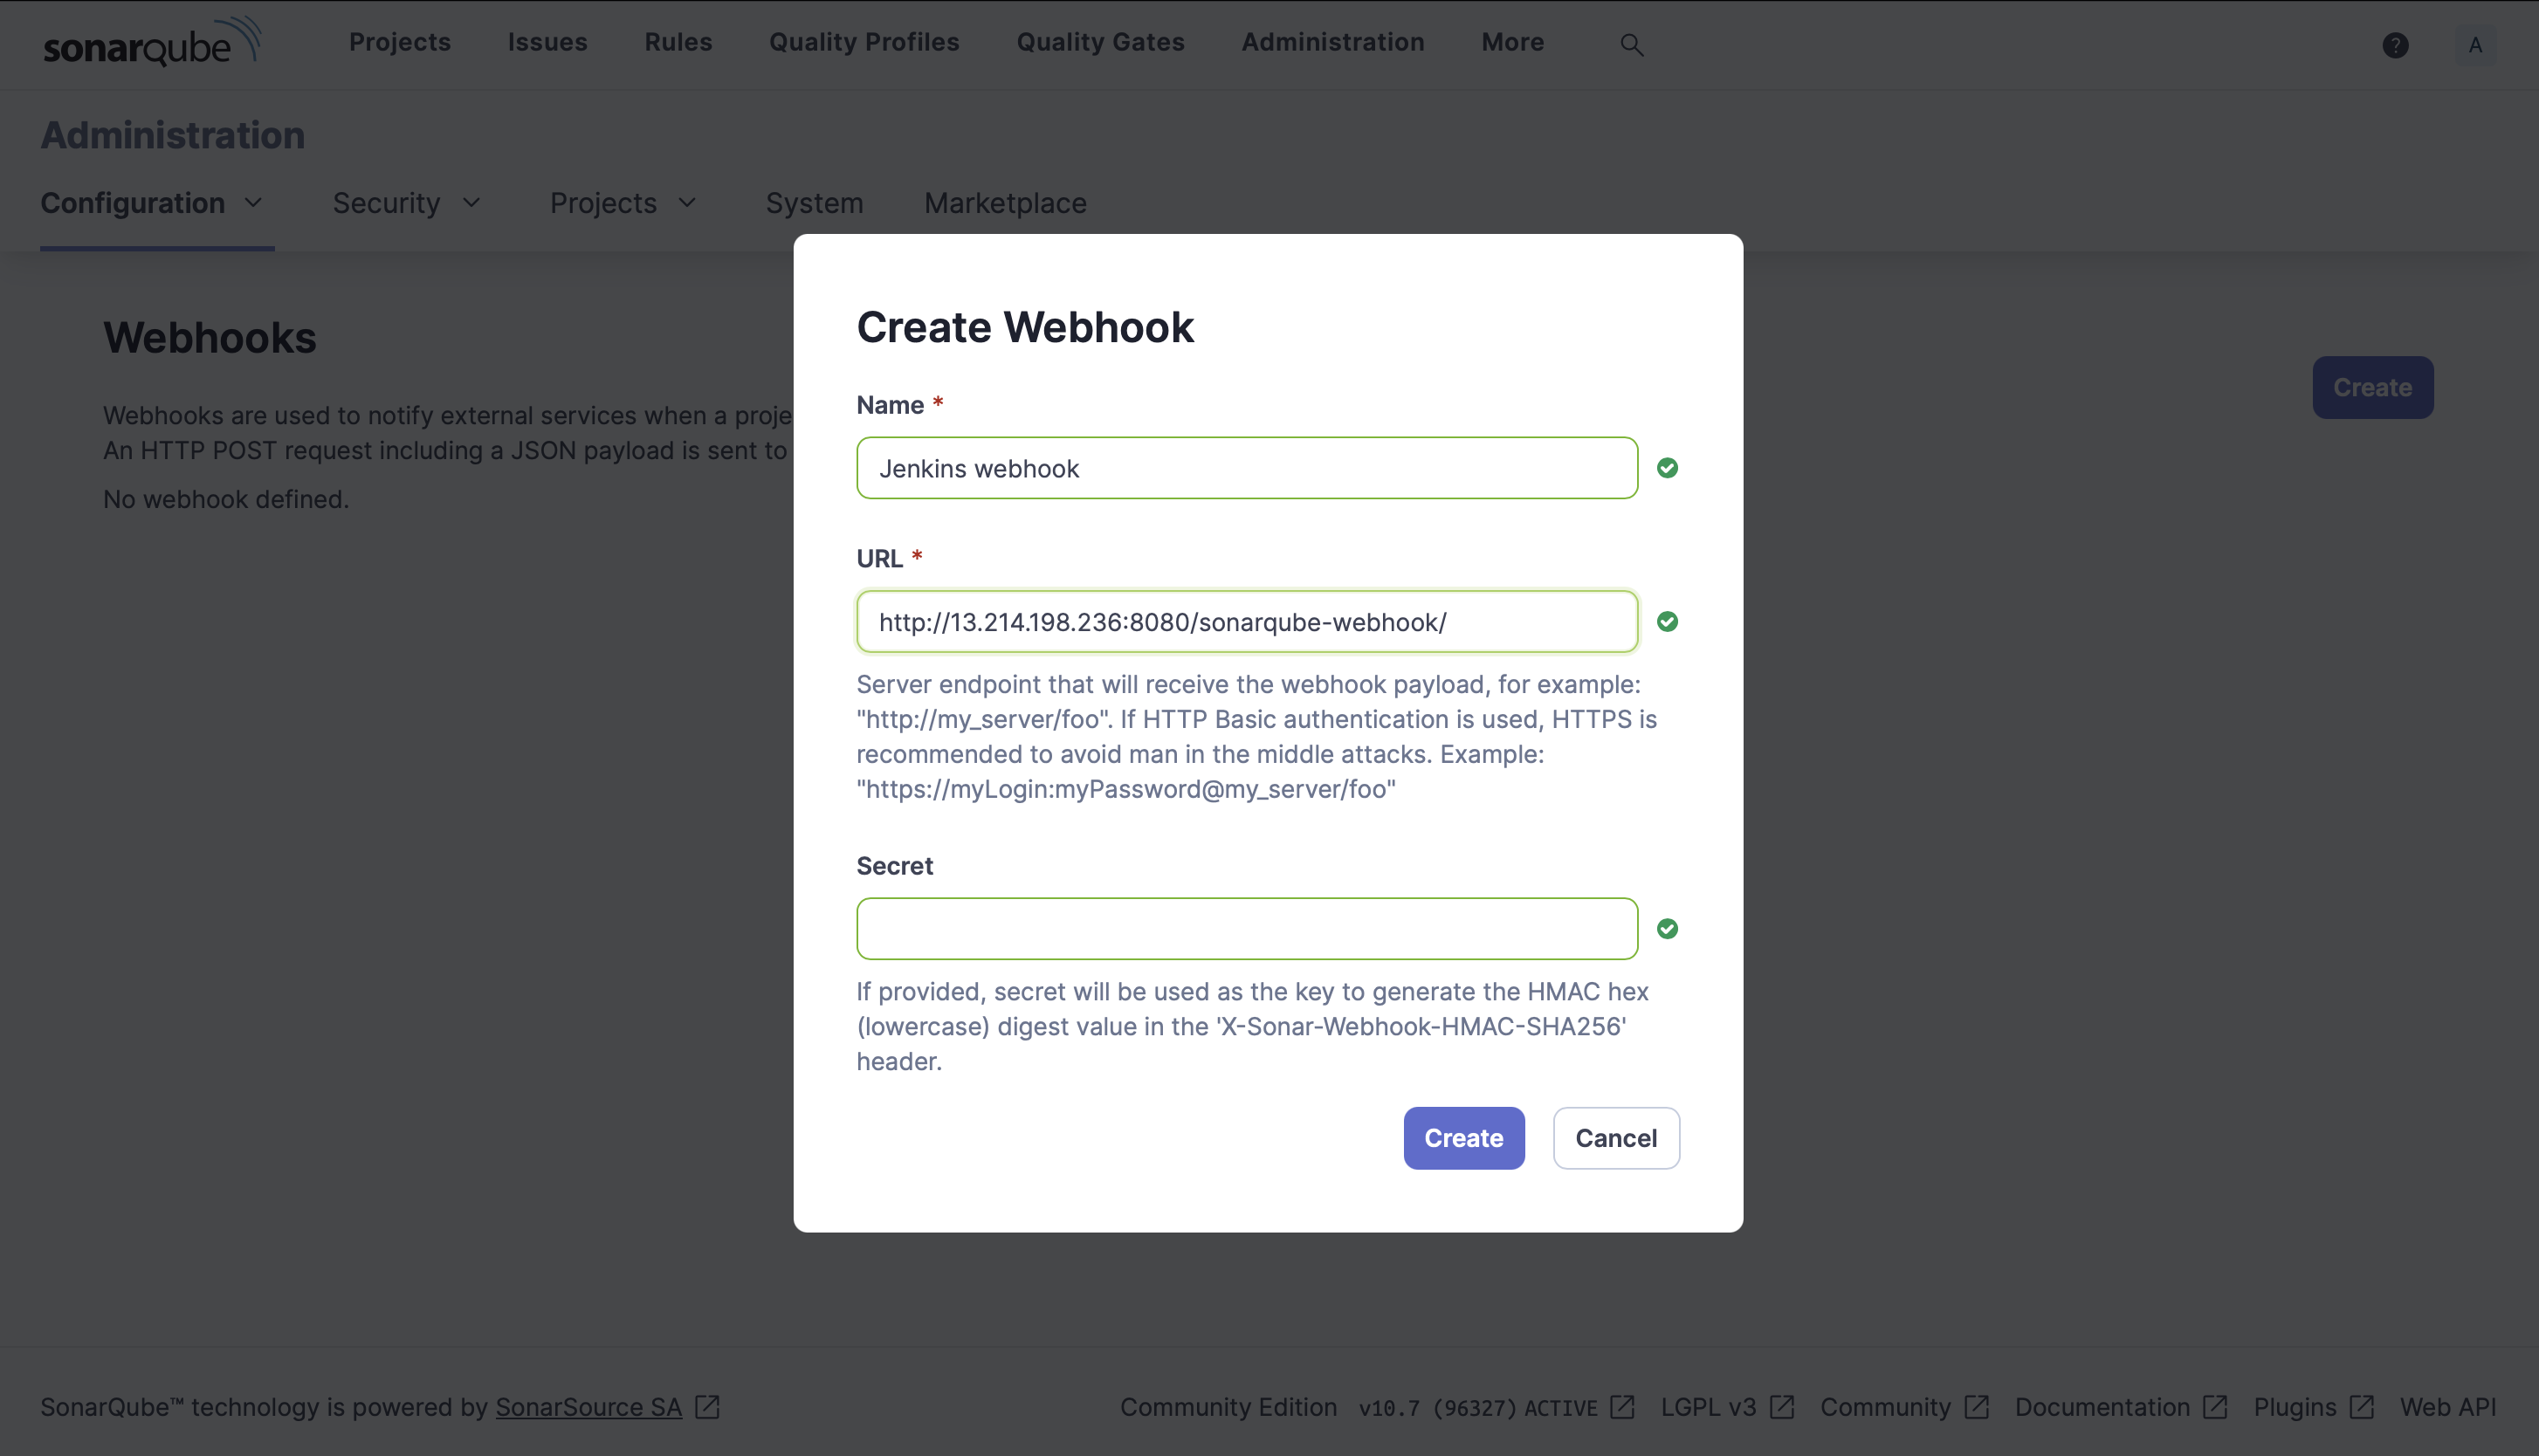
- Click "Create"
With these configurations in place, Jenkins will be able to communicate with SonarQube for code analysis, and SonarQube will be able to send analysis results back to Jenkins, enabling the Quality Gate stage in your pipeline.
Step 10: Create TMDB API Key
To use The Movie Database (TMDB) API in your Netflix Replica, you need to create an API key. Follow these steps:
- Go to the TMDB website (https://www.themoviedb.org/) and create an account if you don't have one.
- Once logged in, go to your account settings by clicking on your avatar in the top right corner.
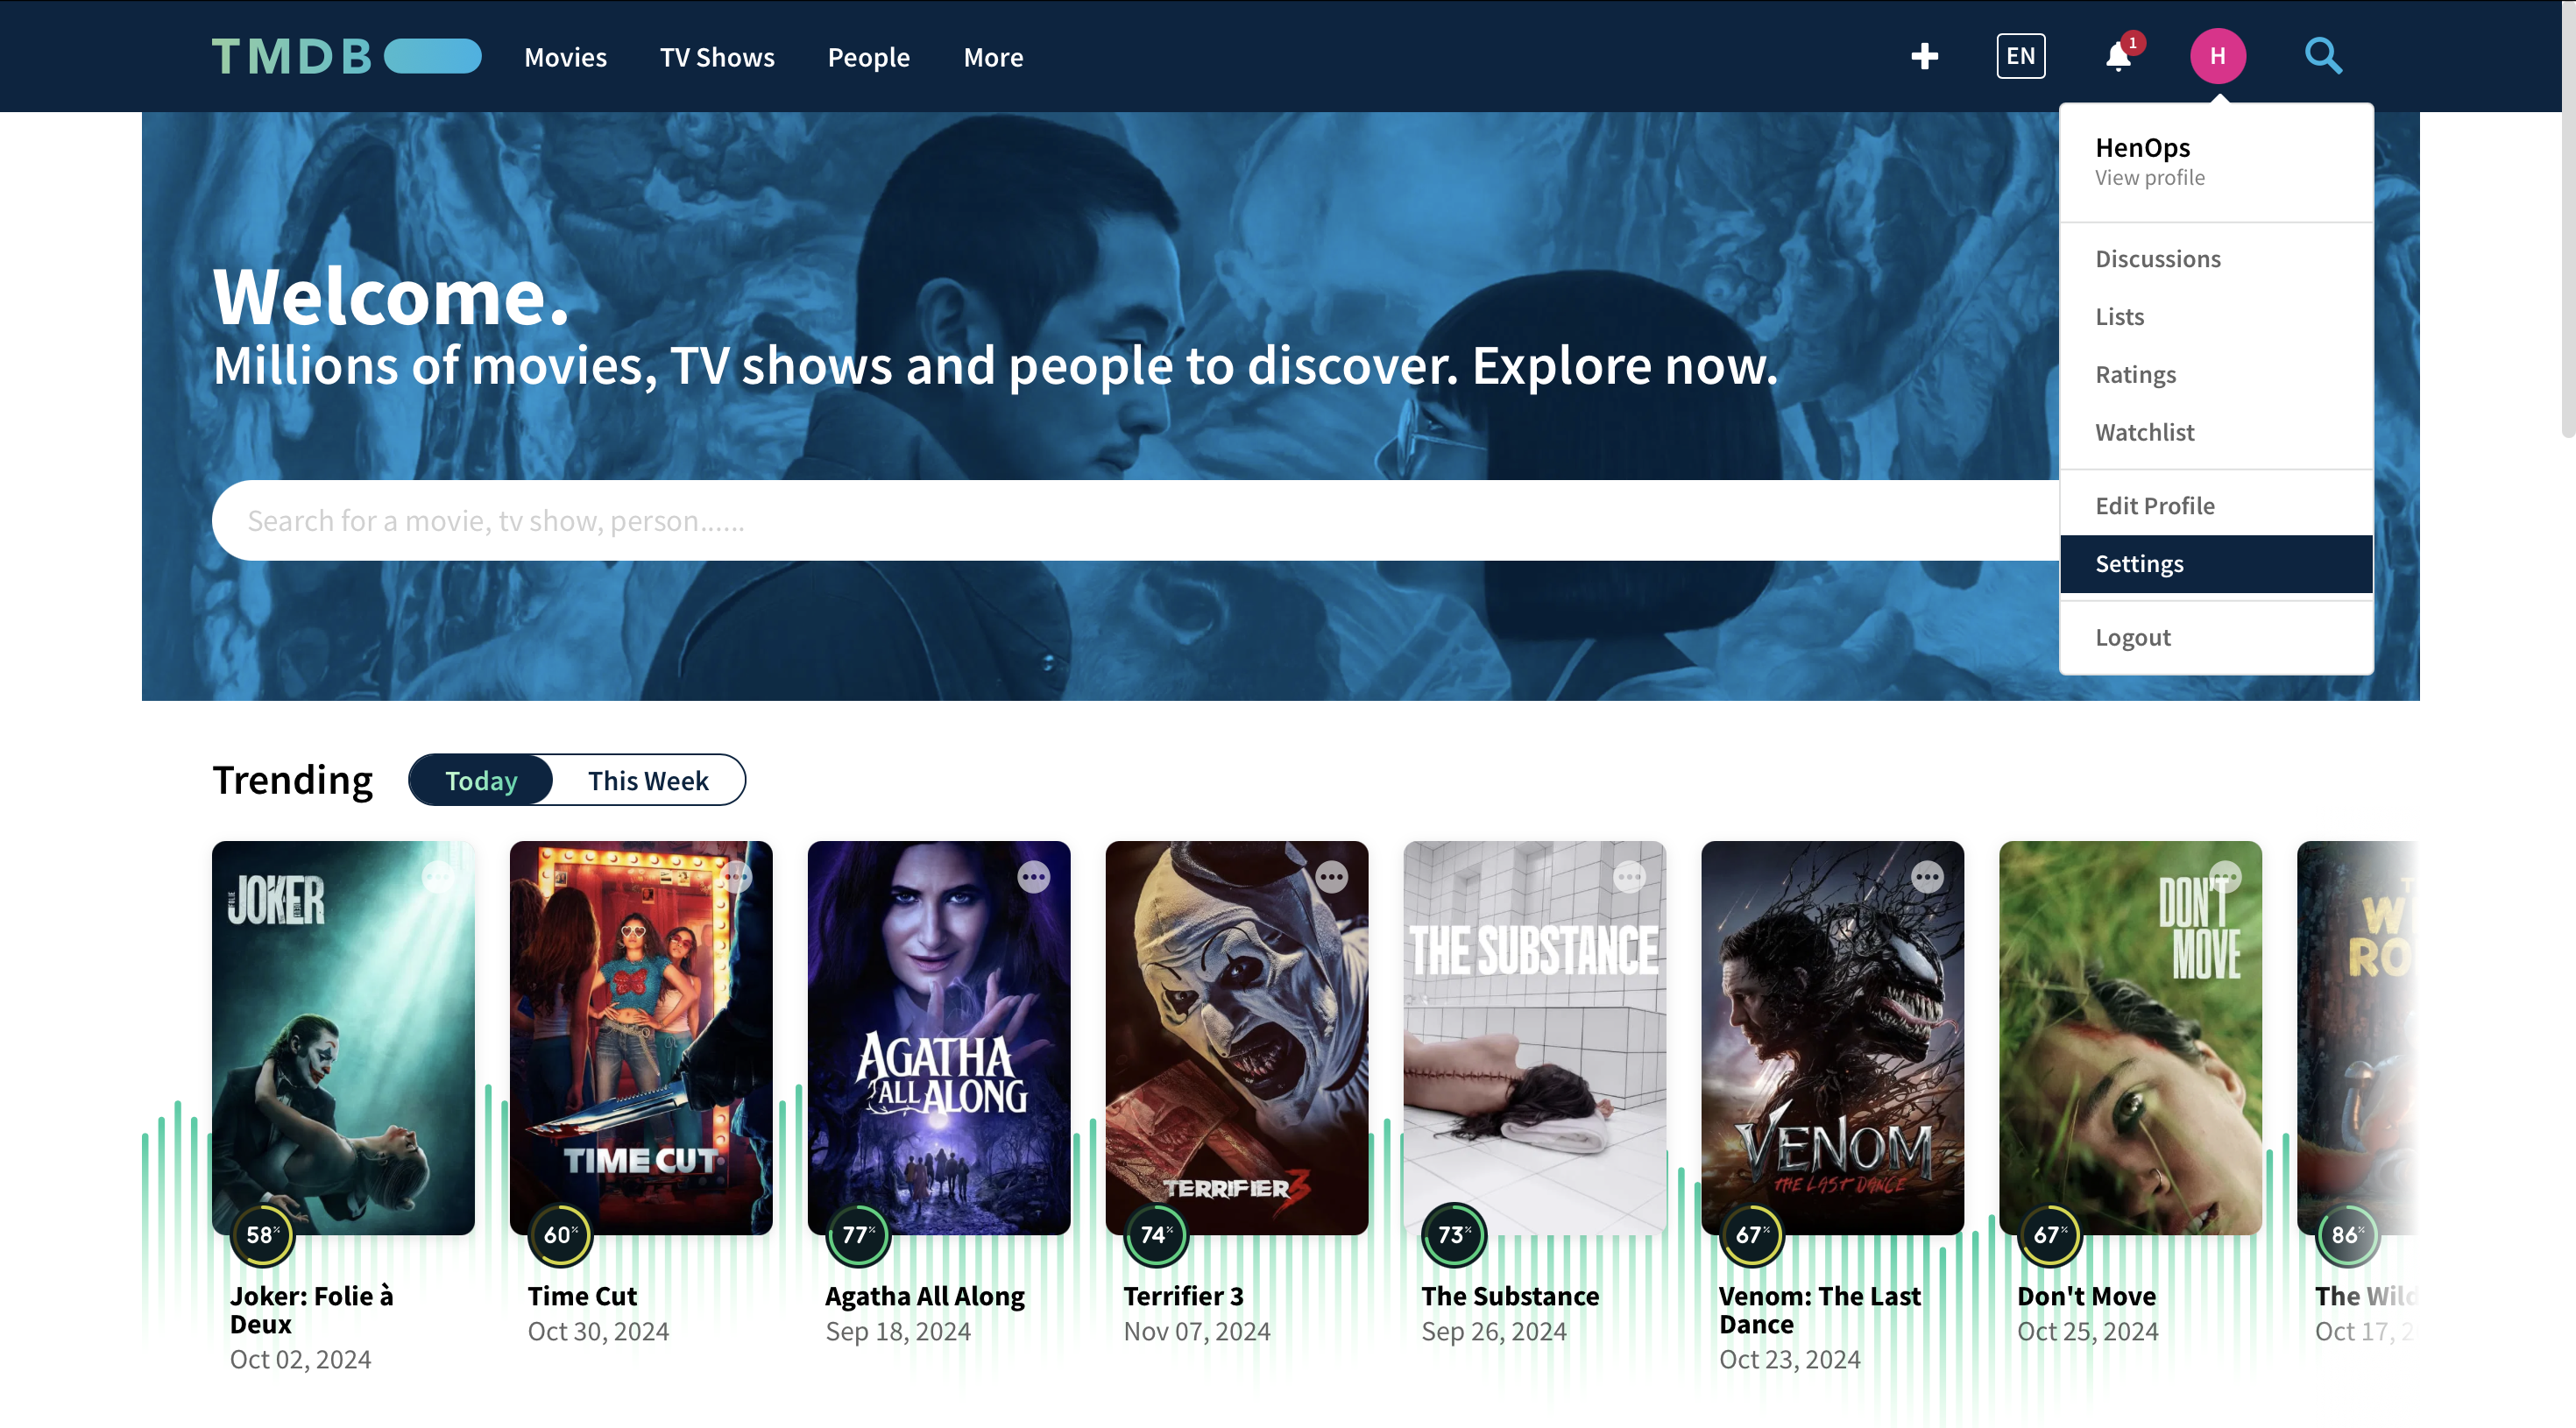
- In the left sidebar, click on "API".
- Click on "Create" under "Request an API Key".
- Choose "Developer" as the type of API key.
- Fill out the form with your application details.
- Agree to the terms of use and click "Submit".
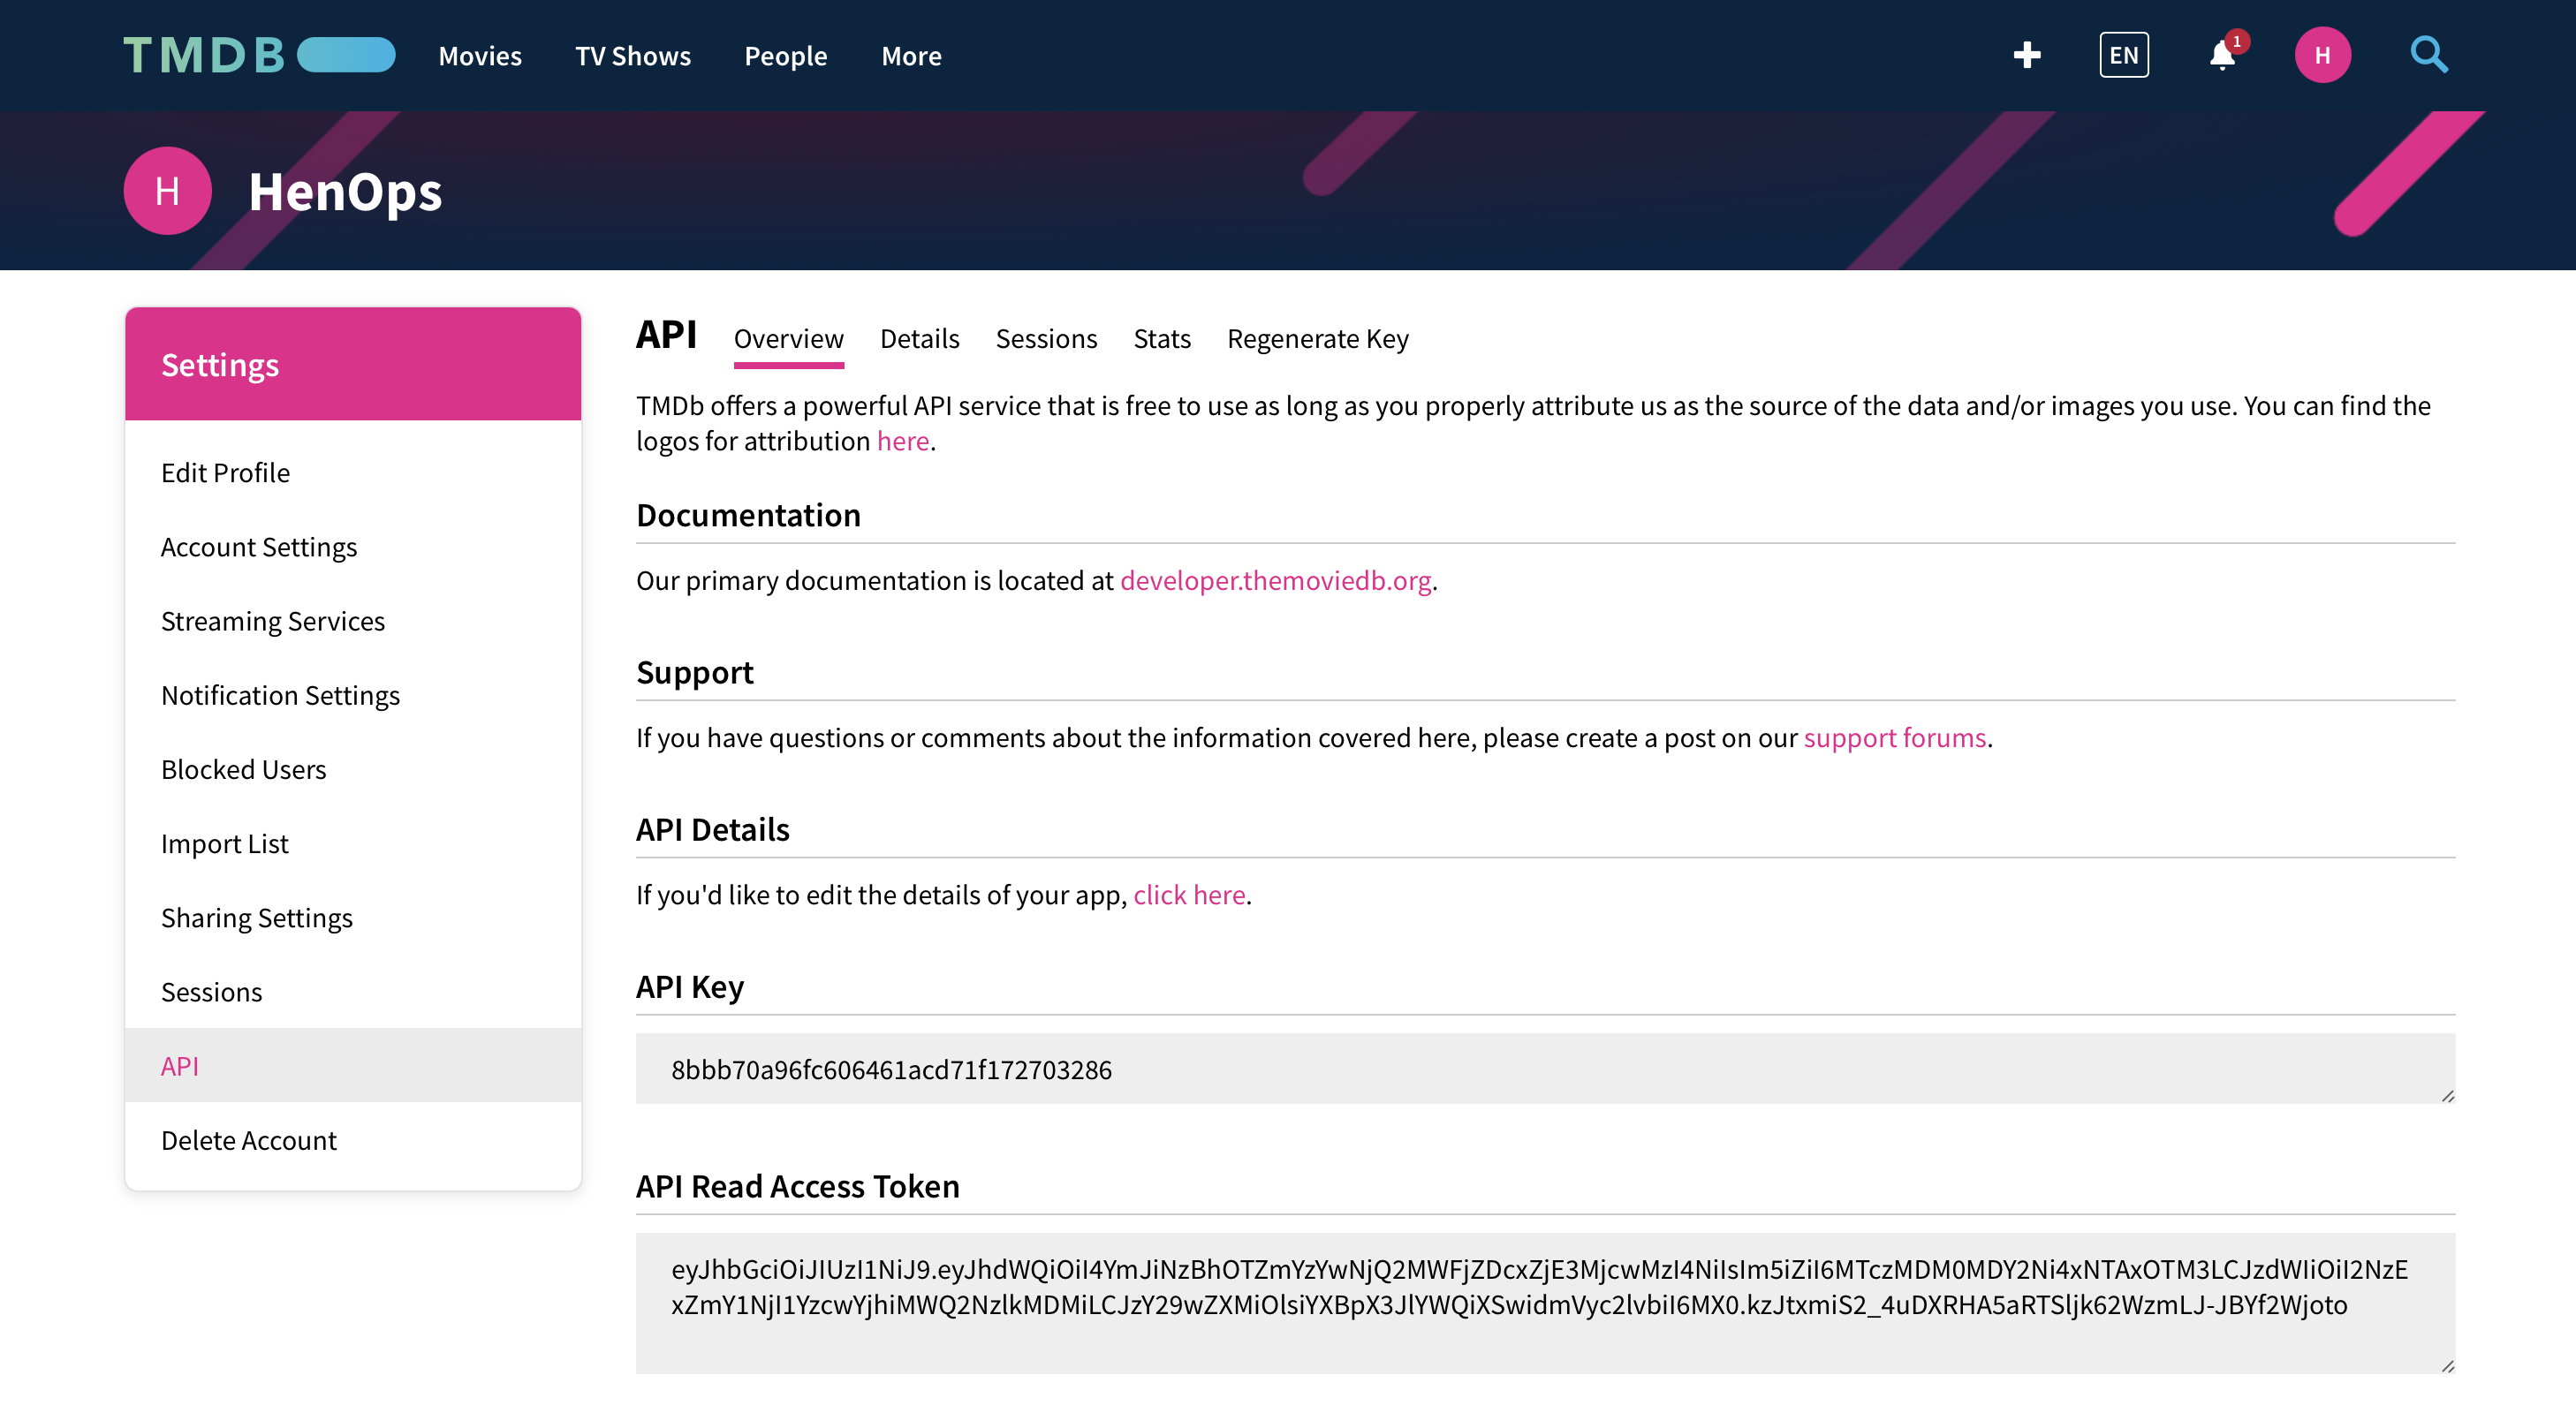
- You will now see your API key. Make sure to keep this key secure and never share it publicly.
Once you have your TMDB API key, you can use it in your application. In the Jenkins pipeline, you can see that the API key is being passed as a build argument to Docker:
docker build --build-arg TMDB_V3_API_KEY=8bbb70a96fc606461acd71f172703286 -t henops/netflix .Replace the example API key with your actual TMDB API key. For security reasons, it's recommended to store this key as a Jenkins credential and reference it in your pipeline, rather than hardcoding it.
Steps 11 - 13: Create Monitoring For Jenkins Server
My user data Script also covers Steps 11 to 13.
Steps 11 - 13: Create Monitoring For Jenkins Server
Step 11: Install Grafana (Optional: Already Installed with userdata)
Grafana is an open-source platform for monitoring and observability. Here's how to install it:
1. Add the Grafana GPG key
wget -q -O - https://packages.grafana.com/gpg.key | sudo apt-key add -2. Add the Grafana repository
echo "deb https://packages.grafana.com/oss/deb stable main" | sudo tee -a /etc/apt/sources.list.d/grafana.list3. Update and install Grafana
sudo apt update
sudo apt install grafana
4. Start and enable Grafana service
sudo systemctl start grafana-server
sudo systemctl enable grafana-server
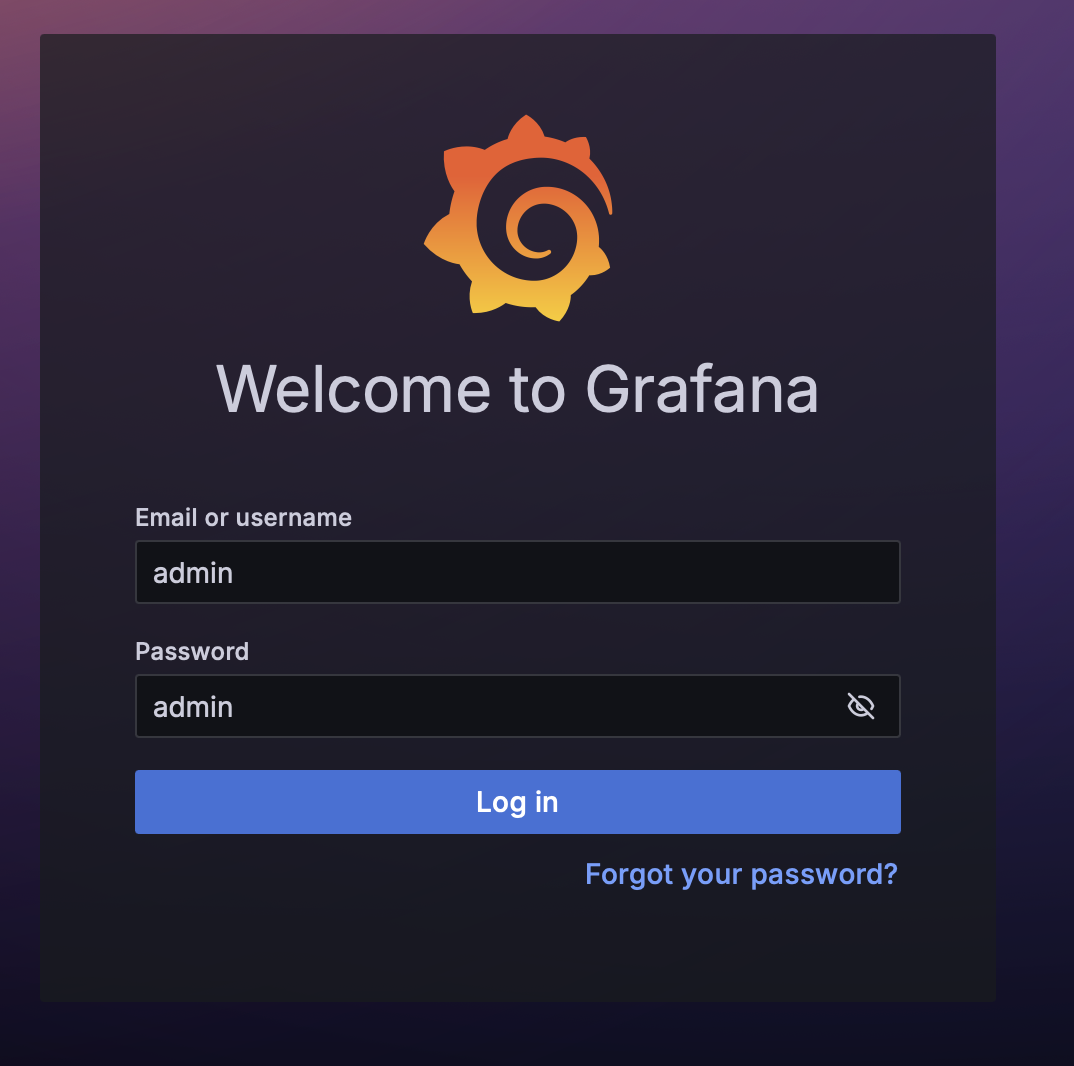
After installation, you can access Grafana by navigating to http://[your-server-ip]:3000 in your web browser. The default login credentials are:
- Username: admin
- Password: admin
You'll be prompted to change the password on your first login.
Step 12: Install and Configure Prometheus (Optional: Already Installed with userdata)
1. Create a system user for Prometheus
sudo useradd --system --no-create-home --shell /bin/false prometheus2. Create directories for Prometheus
sudo mkdir /etc/prometheus
sudo mkdir /var/lib/prometheus
sudo chown prometheus:prometheus /etc/prometheus
sudo chown prometheus:prometheus /var/lib/prometheus
3. Download and install Prometheus
wget https://github.com/prometheus/prometheus/releases/download/v2.37.0/prometheus-2.37.0.linux-amd64.tar.gz
tar xvf prometheus-2.37.0.linux-amd64.tar.gz
sudo mv prometheus-2.37.0.linux-amd64/prometheus /usr/local/bin/
sudo mv prometheus-2.37.0.linux-amd64/promtool /usr/local/bin/
cd prometheus-2.37.0.linux-amd64/
sudo mv consoles/ console_libraries/ /etc/prometheus/
sudo chown prometheus:prometheus /usr/local/bin/prometheus
sudo chown prometheus:prometheus /usr/local/bin/promtool
4. Configure Prometheus (Optional: Already Installed with userdata)
Create and edit the Prometheus configuration file:
sudo vim /etc/prometheus/prometheus.ymlAdd the following content:
global:
  scrape_interval: 15s

scrape_configs:
  - job_name: 'prometheus'
    static_configs:
      - targets: ['localhost:9090']
  - job_name: 'node_exporter'
    static_configs:
      - targets: ['localhost:9100']
  - job_name: 'jenkins'
    metrics_path: '/prometheus'
    static_configs:
      - targets: ['localhost:8080']
5. Create a Prometheus service file (Optional: Already Installed with userdata)
sudo vim /etc/systemd/system/prometheus.serviceAdd the following content:
[Unit]
Description=Prometheus
Wants=network-online.target
After=network-online.target

[Service]
User=prometheus
Group=prometheus
Type=simple
ExecStart=/usr/local/bin/prometheus \
    --config.file /etc/prometheus/prometheus.yml \
    --storage.tsdb.path /var/lib/prometheus/ \
    --web.console.templates=/etc/prometheus/consoles \
    --web.console.libraries=/etc/prometheus/console_libraries

[Install]
WantedBy=multi-user.target
6. Start and enable Prometheus service
sudo systemctl daemon-reload
sudo systemctl start prometheus
sudo systemctl enable prometheus
Step 13: Install and Configure Node Exporter (Optional: Already Installed with userdata)
1. Create a system user for Node Exporter
sudo useradd --system --no-create-home --shell /bin/false node_exporter2. Download and install Node Exporter
wget https://github.com/prometheus/node_exporter/releases/download/v1.3.1/node_exporter-1.3.1.linux-amd64.tar.gz
tar xvf node_exporter-1.3.1.linux-amd64.tar.gz
sudo mv node_exporter-1.3.1.linux-amd64/node_exporter /usr/local/bin/
sudo chown node_exporter:node_exporter /usr/local/bin/node_exporter
3. Create a Node Exporter service file
sudo vim /etc/systemd/system/node_exporter.serviceAdd the following content:
[Unit]
Description=Node Exporter
Wants=network-online.target
After=network-online.target

[Service]
User=node_exporter
Group=node_exporter
Type=simple
ExecStart=/usr/local/bin/node_exporter --web.listen-address=:9101

[Install]
WantedBy=multi-user.target
4. Start and enable Node Exporter service
sudo systemctl daemon-reload
sudo systemctl start node_exporter
sudo systemctl enable node_exporter
Then check for all the configurations and reload the prometheus
promtool check config /etc/prometheus/prometheus.yml
curl -X POST http://localhost:9090/-/reload
Examine the targets section in Prometheus, utilizing the public IP address of the Ubuntu instance along with port number 9090.
http://<ip>:9090/targets
Step 14: Configure Jenkins for Prometheus
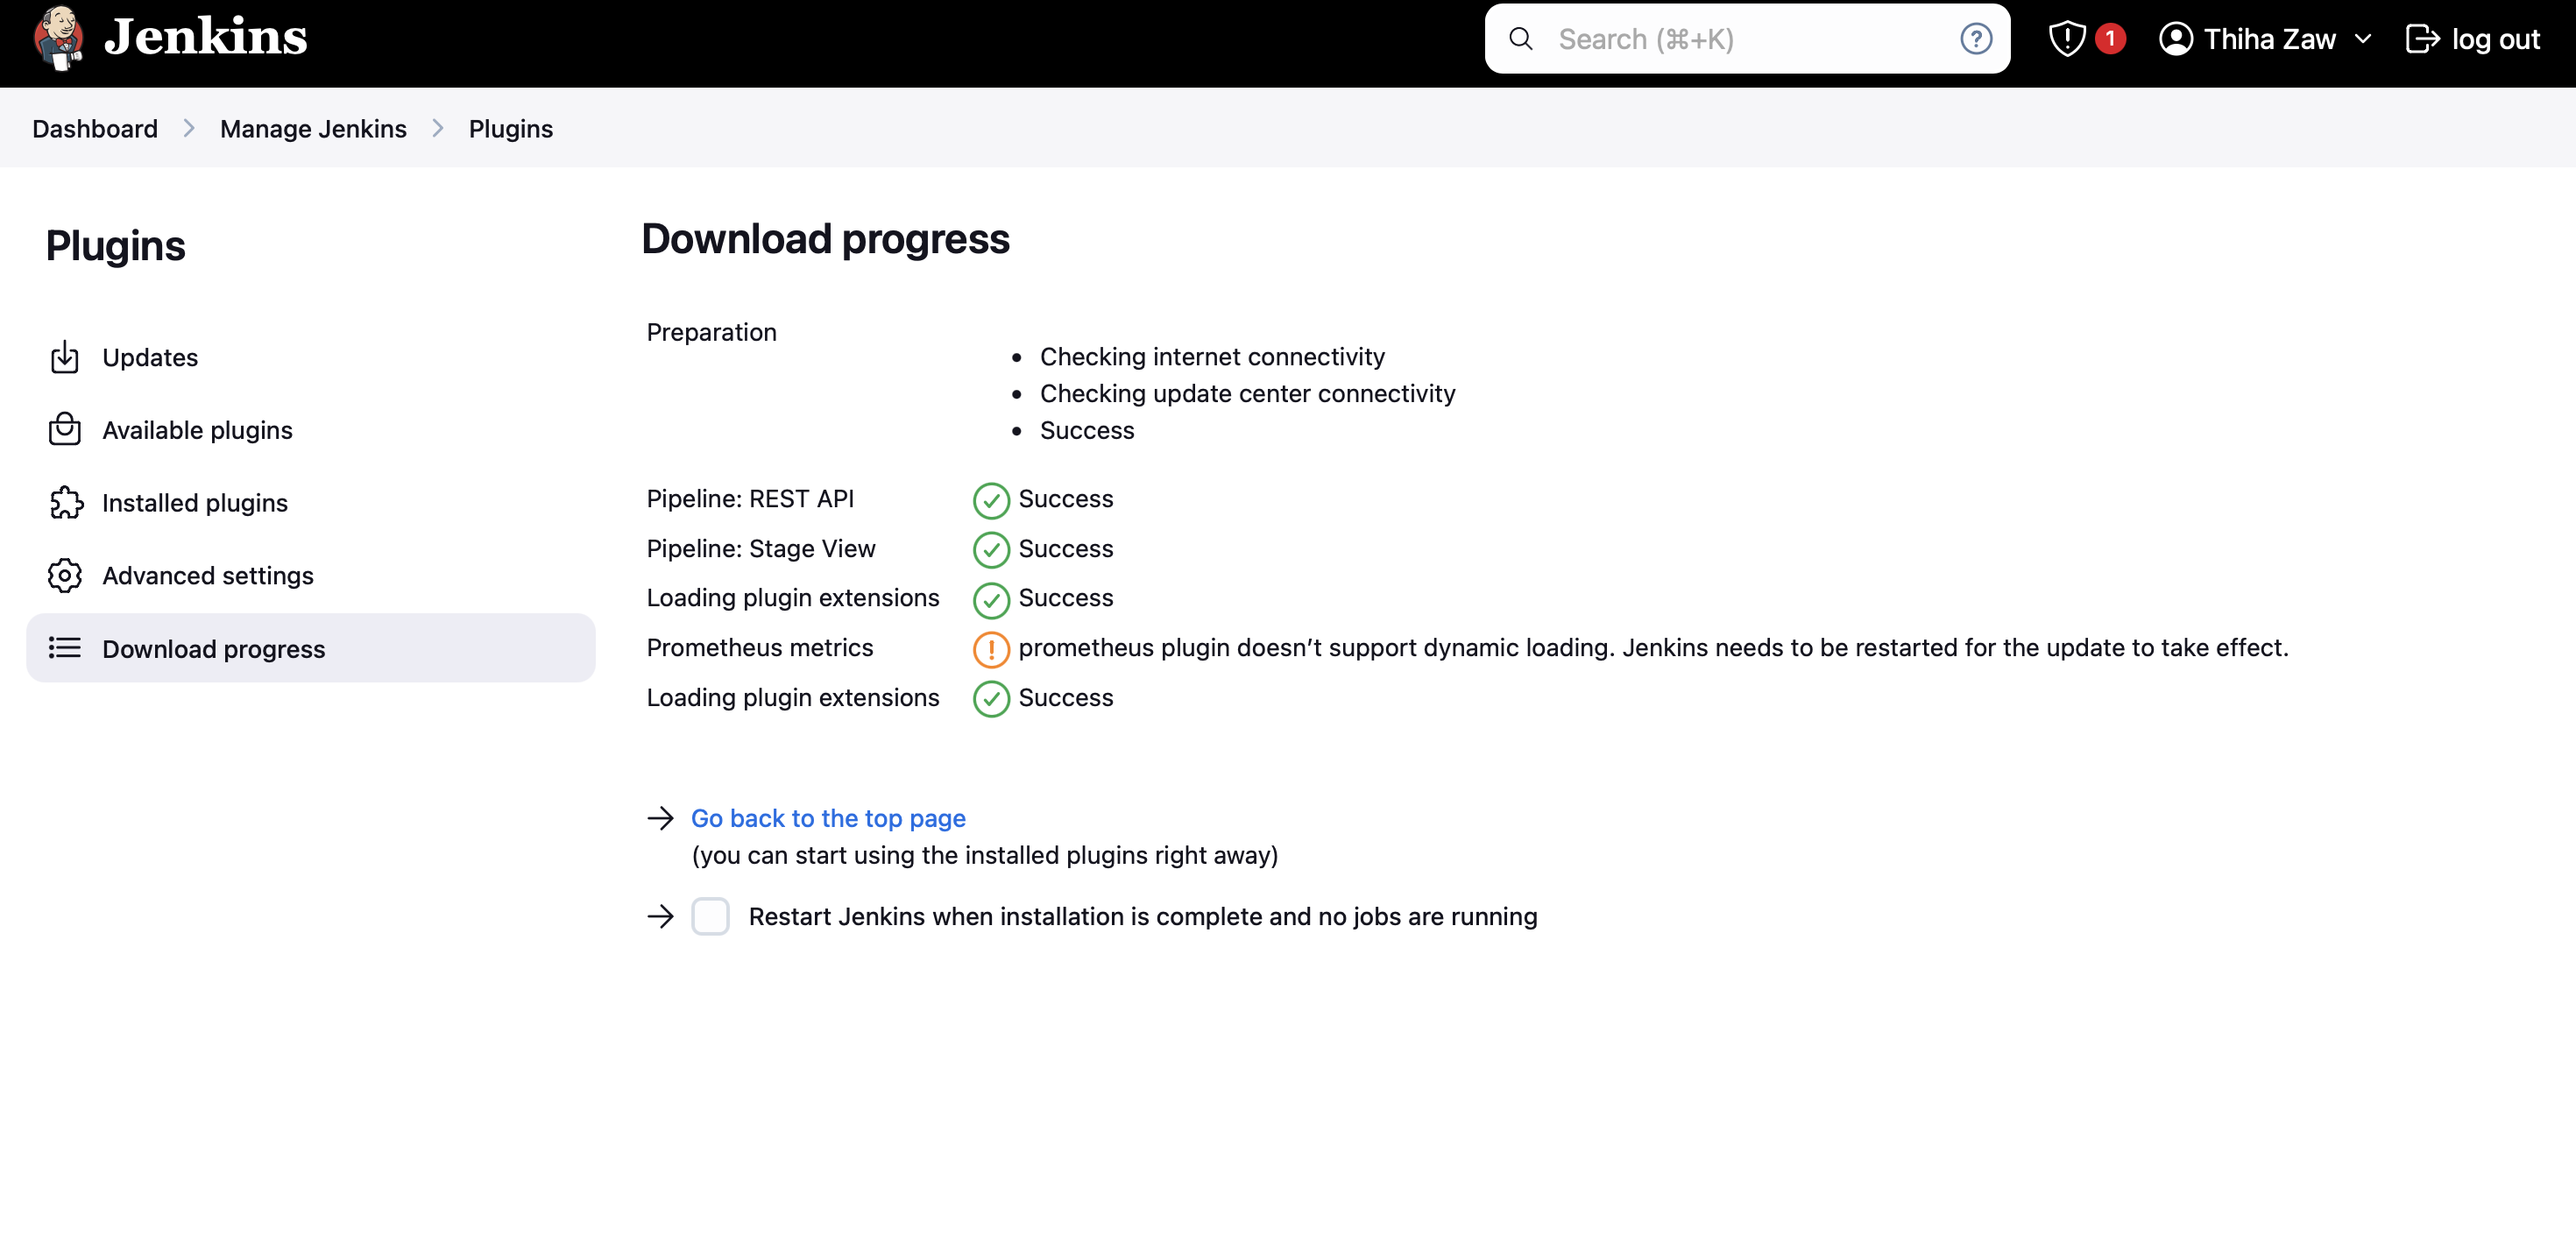
Install the Prometheus plugin in Jenkins:
- Go to Manage Jenkins > Manage Plugins
- Search for "Prometheus metrics" in the Available tab
- Install the plugin and restart Jenkins
Step 15: Configure Grafana
1. Add Prometheus as a data source in Grafana
- Log in to Grafana (http://[your-server-ip]:3000)
- Go to Configuration > Data Sources
- Click "Add data source" and select Prometheus
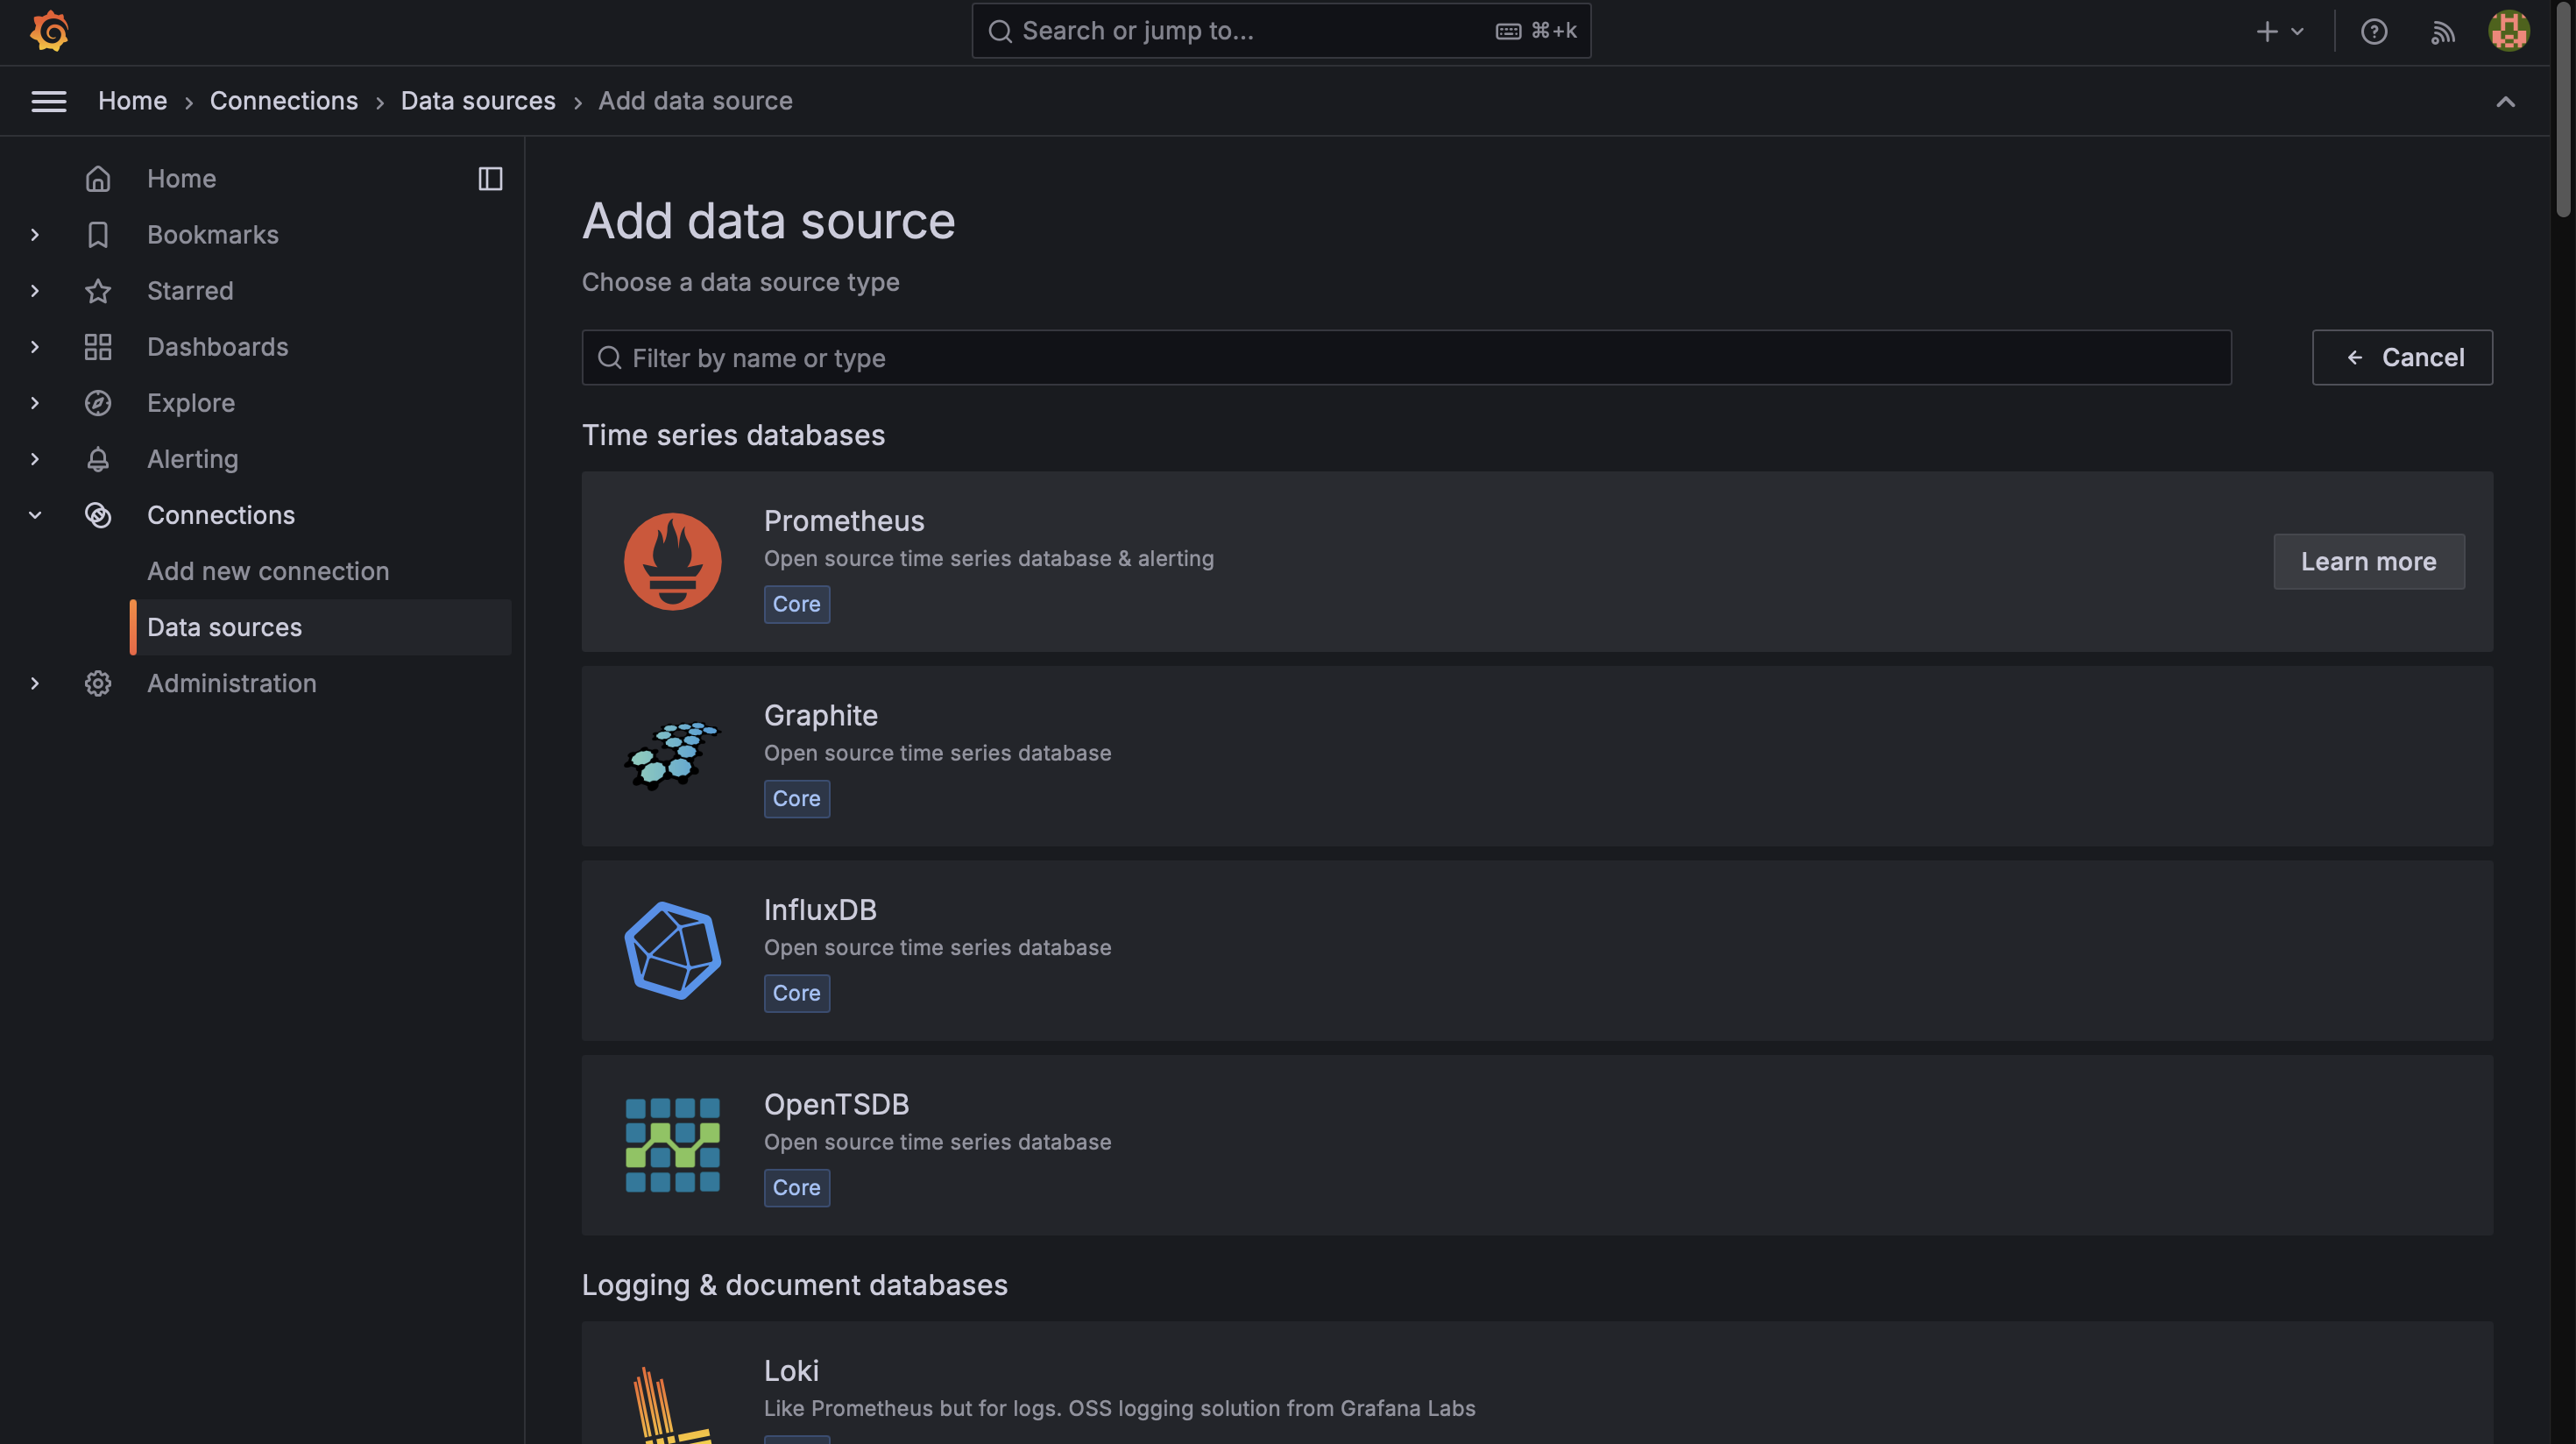
- Set the URL to http://localhost:9090 (which is default) if you run with terraform, please use http://localhost:7718

- Click "Save & Test" to verify the connection
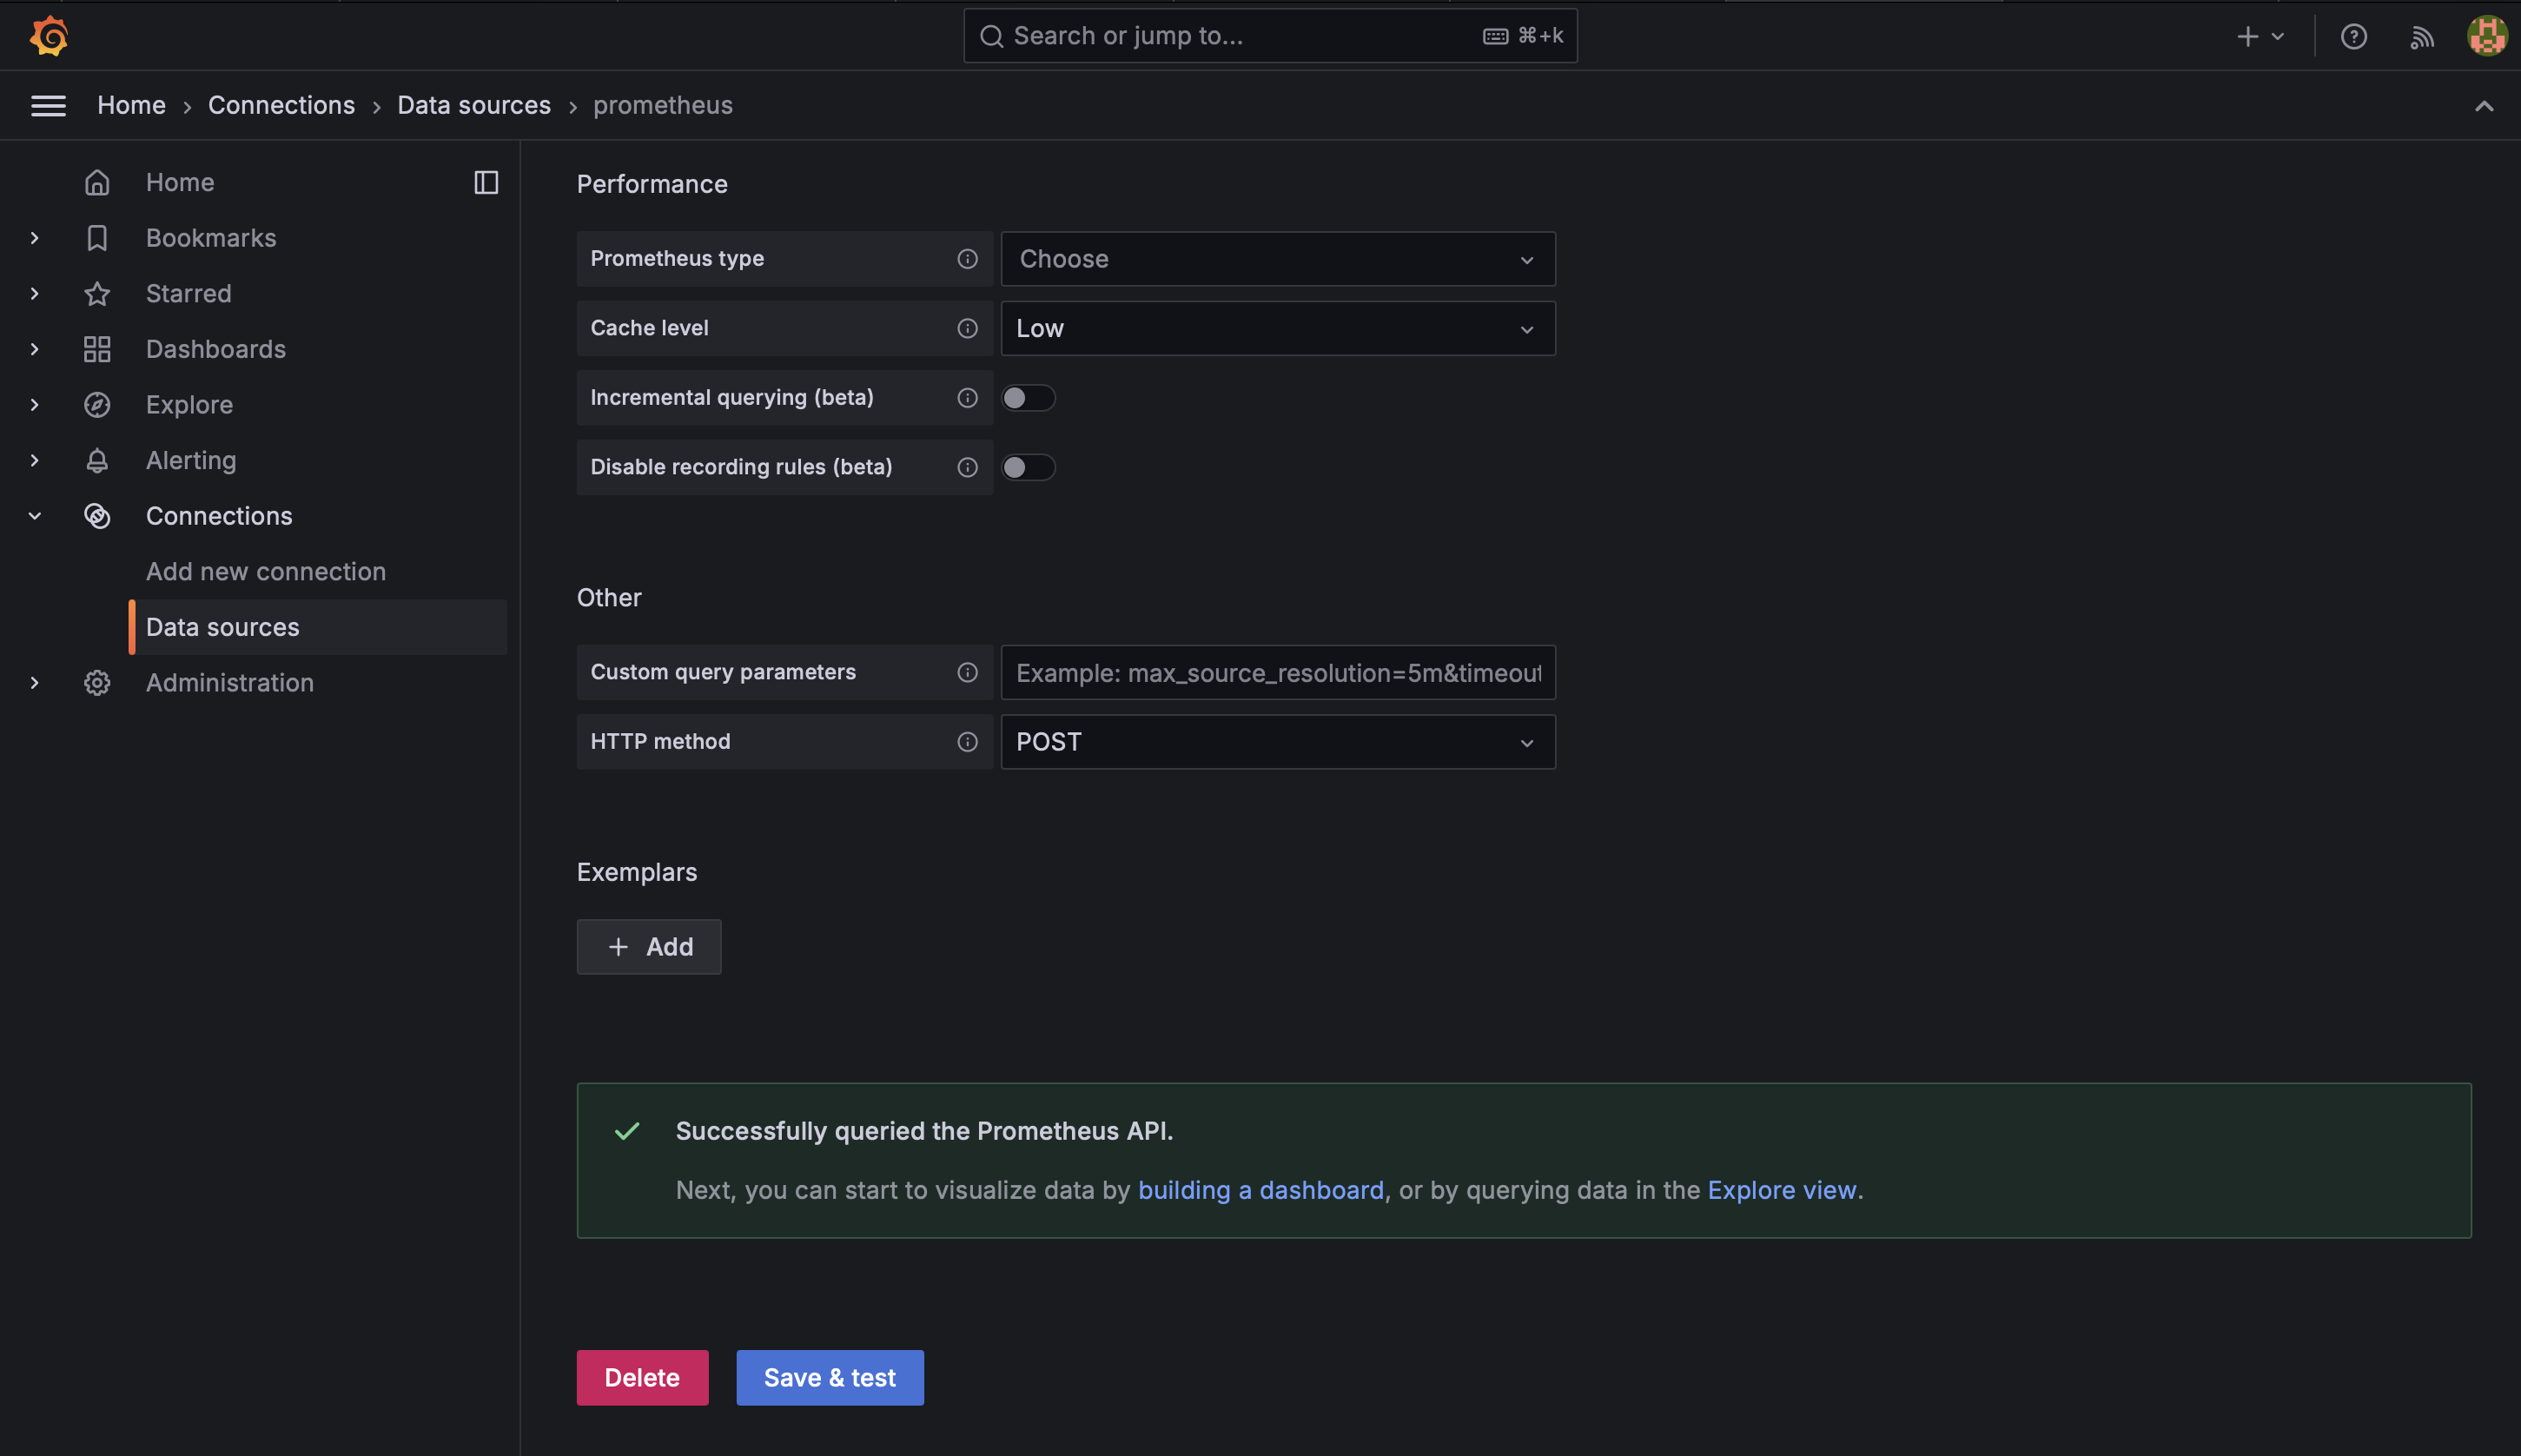
2. Import dashboards
Import pre-built dashboards for Node Exporter and Jenkins:
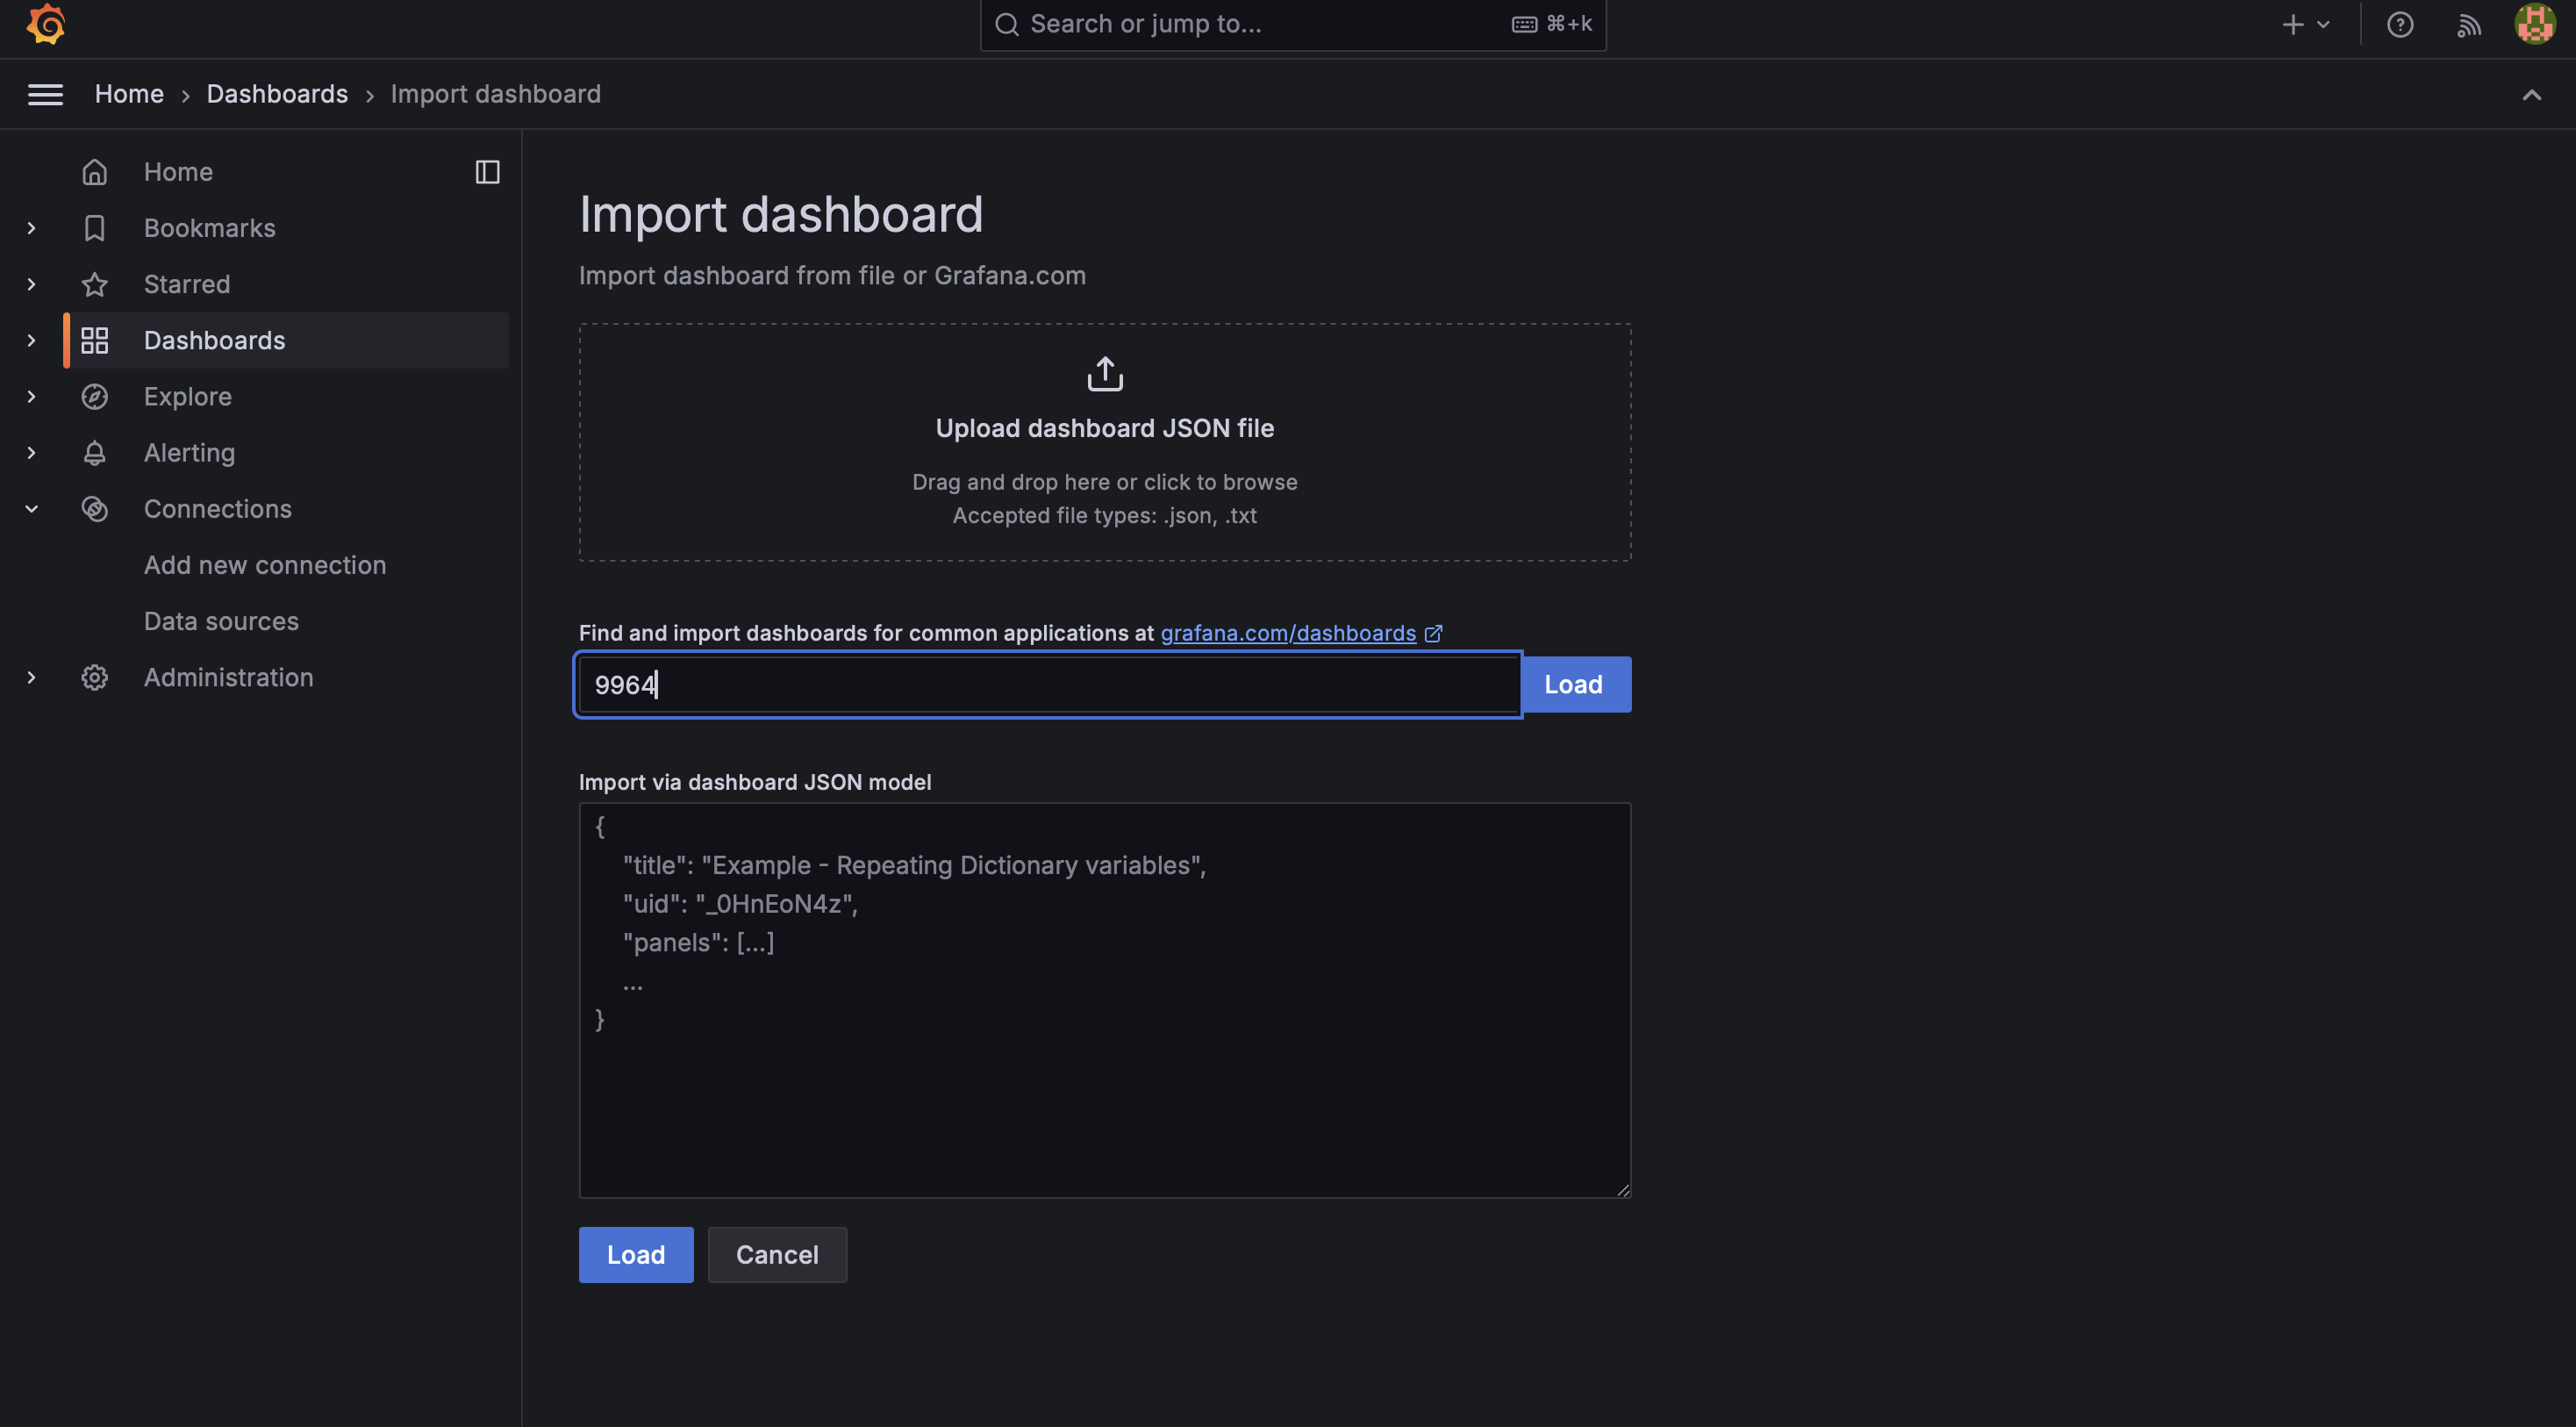
- Go to Create > Import
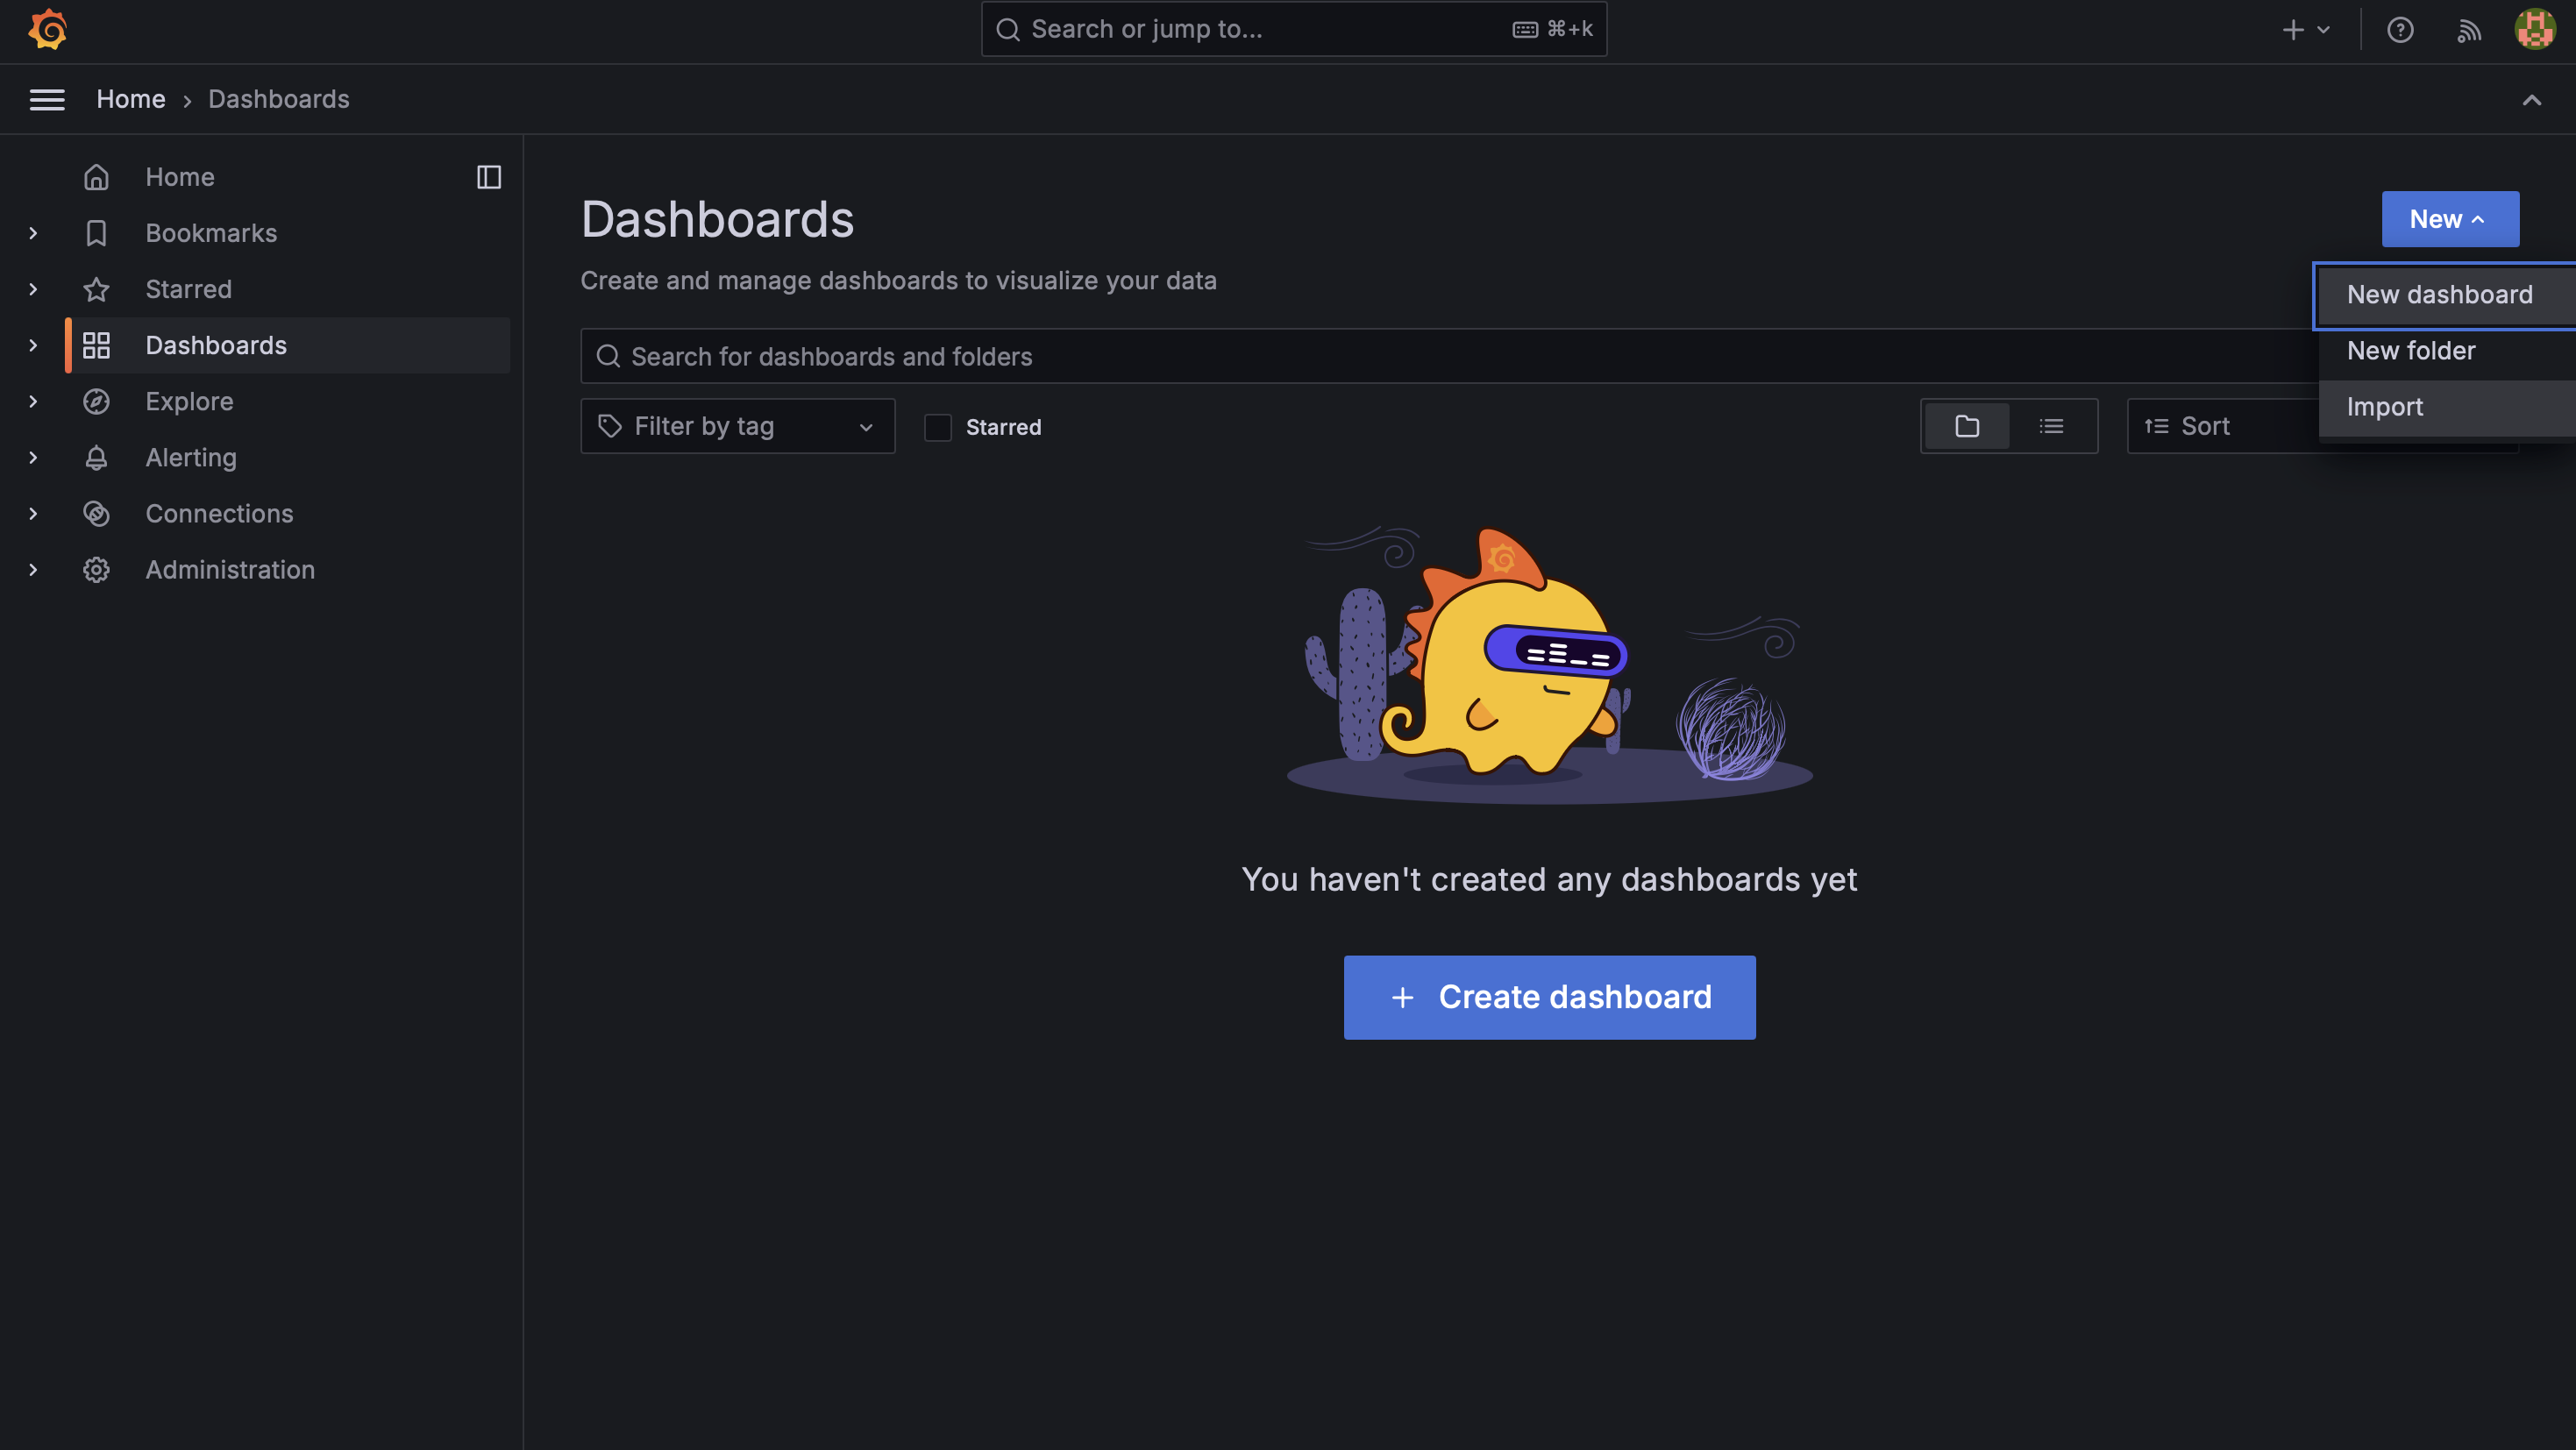
- Enter dashboard ID 1860 for Node Exporter Full
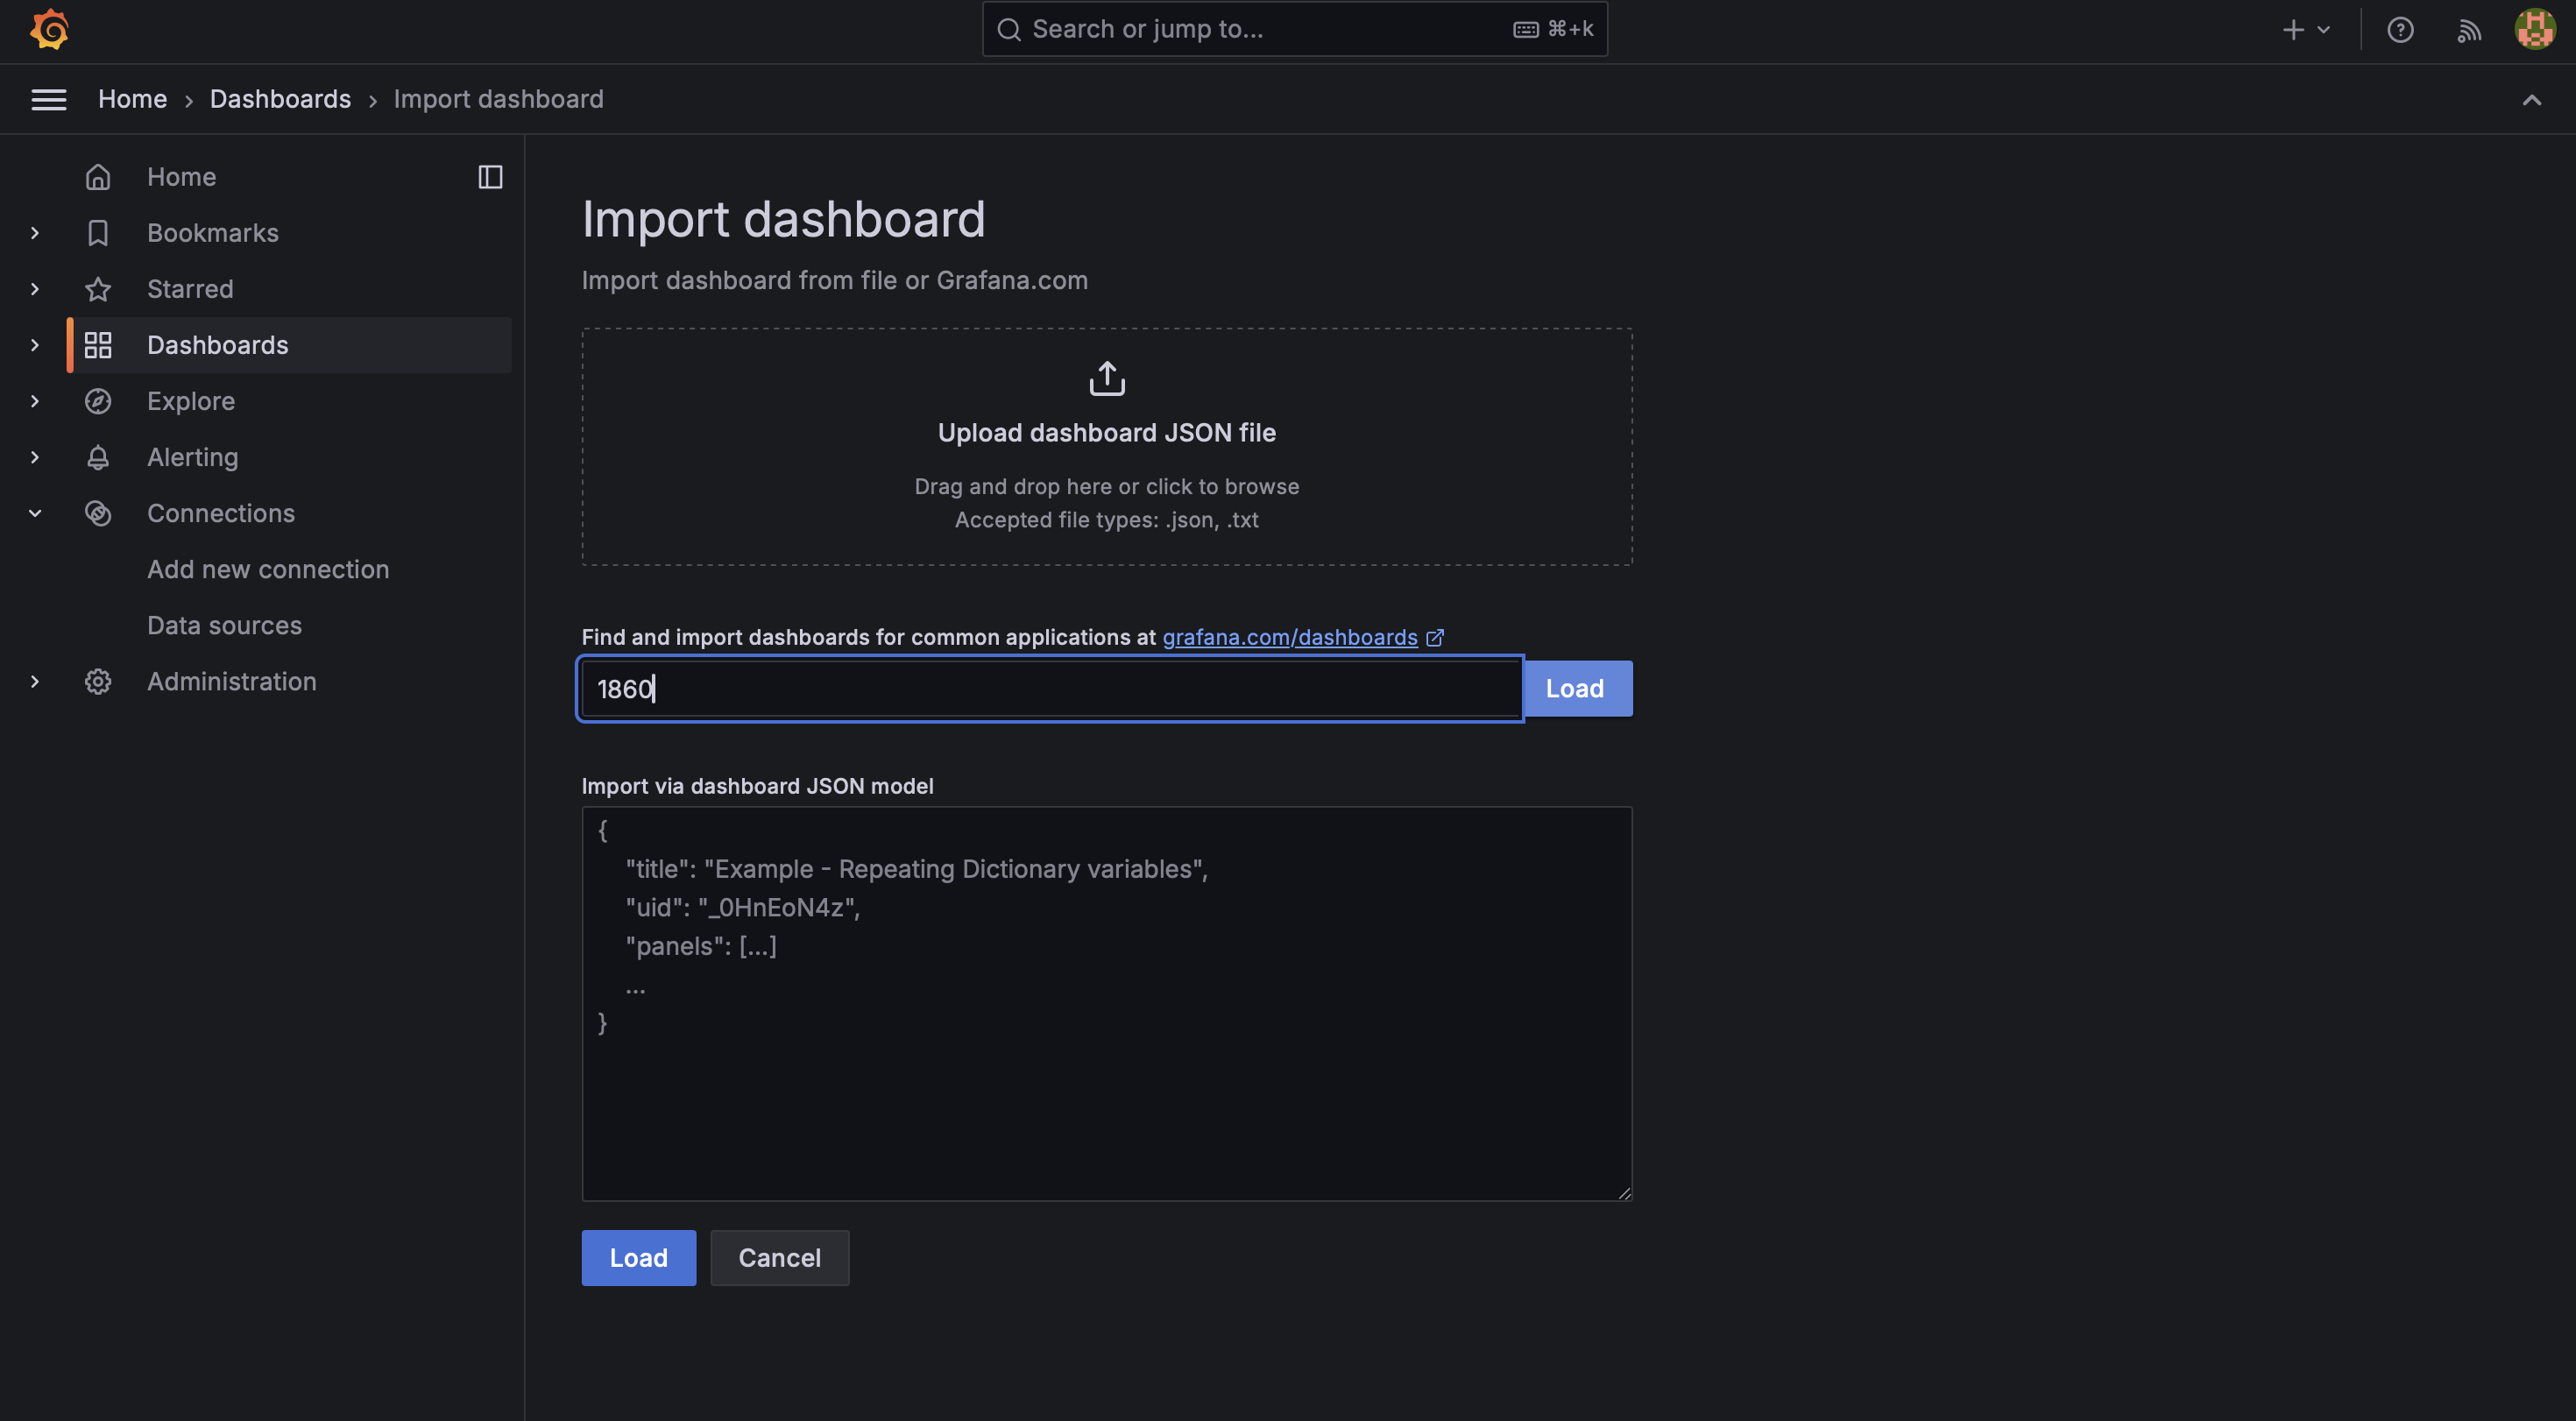
- Enter dashboard ID 9964 for Jenkins Performance and Health Overview
- Select the Prometheus data source for both dashboards
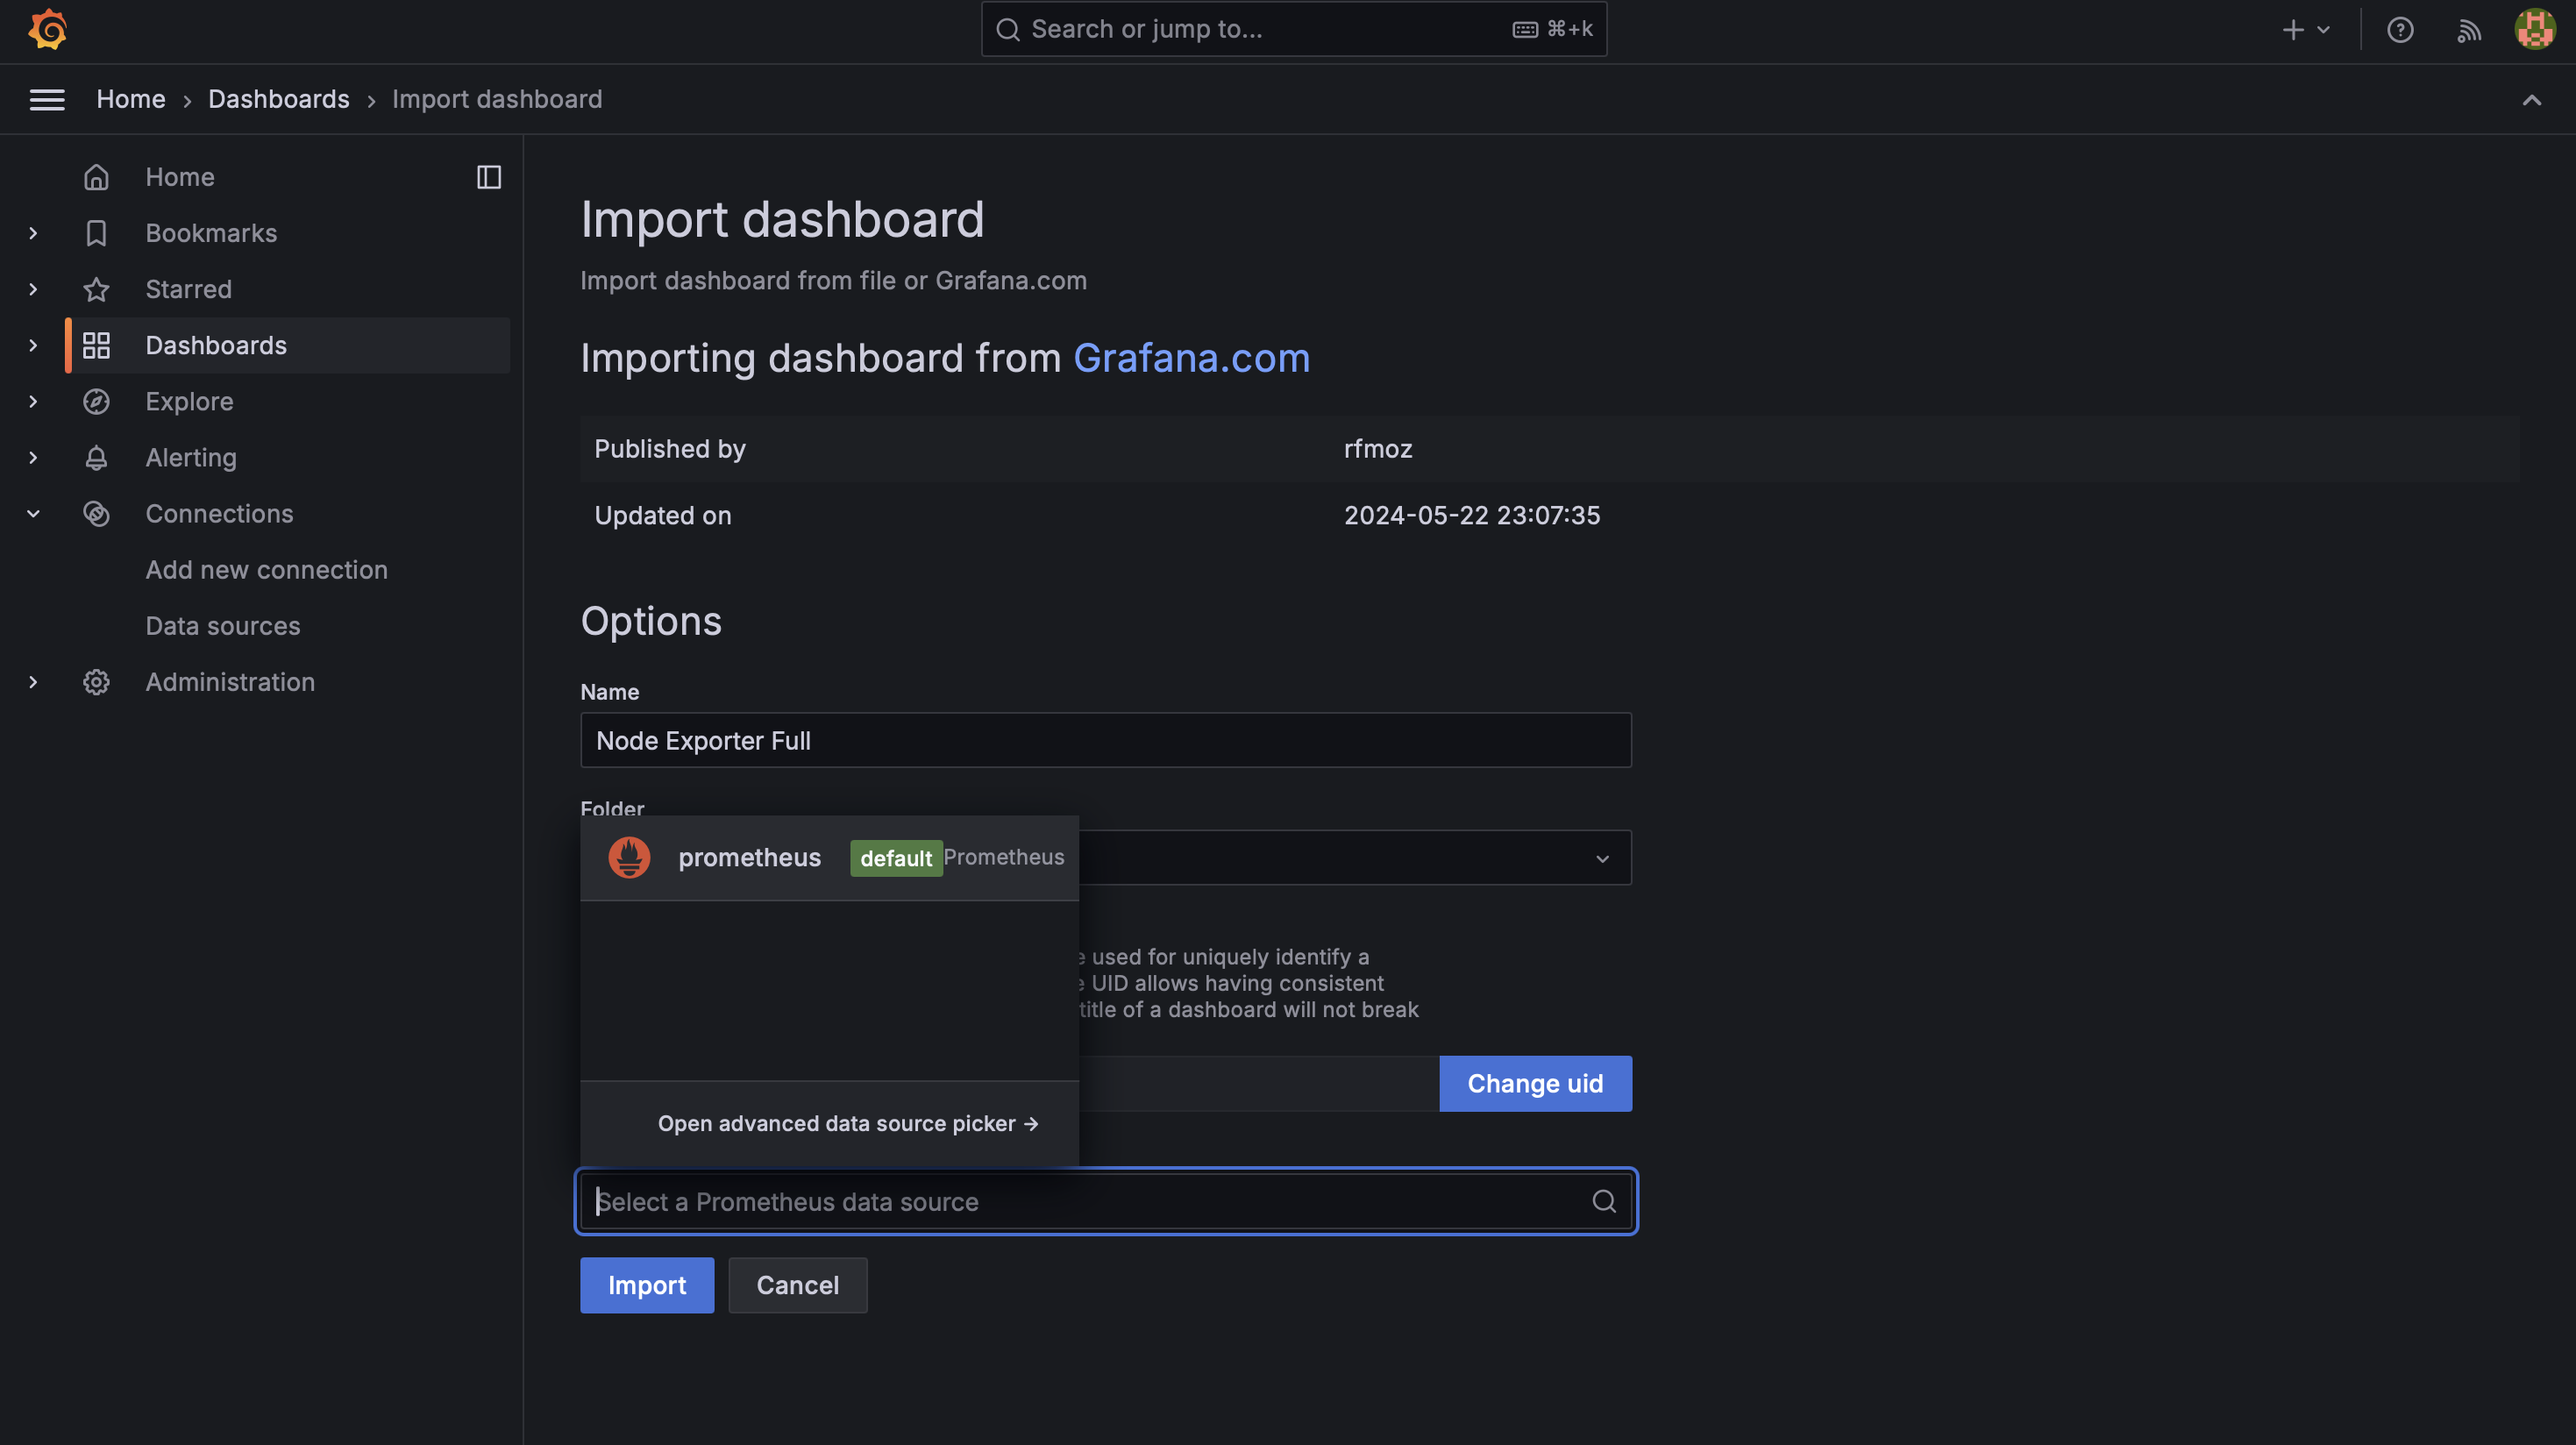
With these steps completed, you now have Prometheus collecting metrics from your system and Jenkins, with Grafana providing visualization of these metrics through pre-built dashboards.
Generate App Password for Gmail (Optional)
To use Gmail with Jenkins, you'll need to generate an App Password:
- Go to your Google Account settings (https://myaccount.google.com/)
- Navigate to "Security"
- Under "Signing in to Google," select "2-Step Verification"
- Scroll to the bottom and select "App passwords"
- Choose "Mail" and "Other (Custom name)" from the dropdowns
- If you can’t find, you can go directly from this link - https://myaccount.google.com/apppasswords
- Enter a name for the app (e.g., "Jenkins Email")
- Click "Generate"
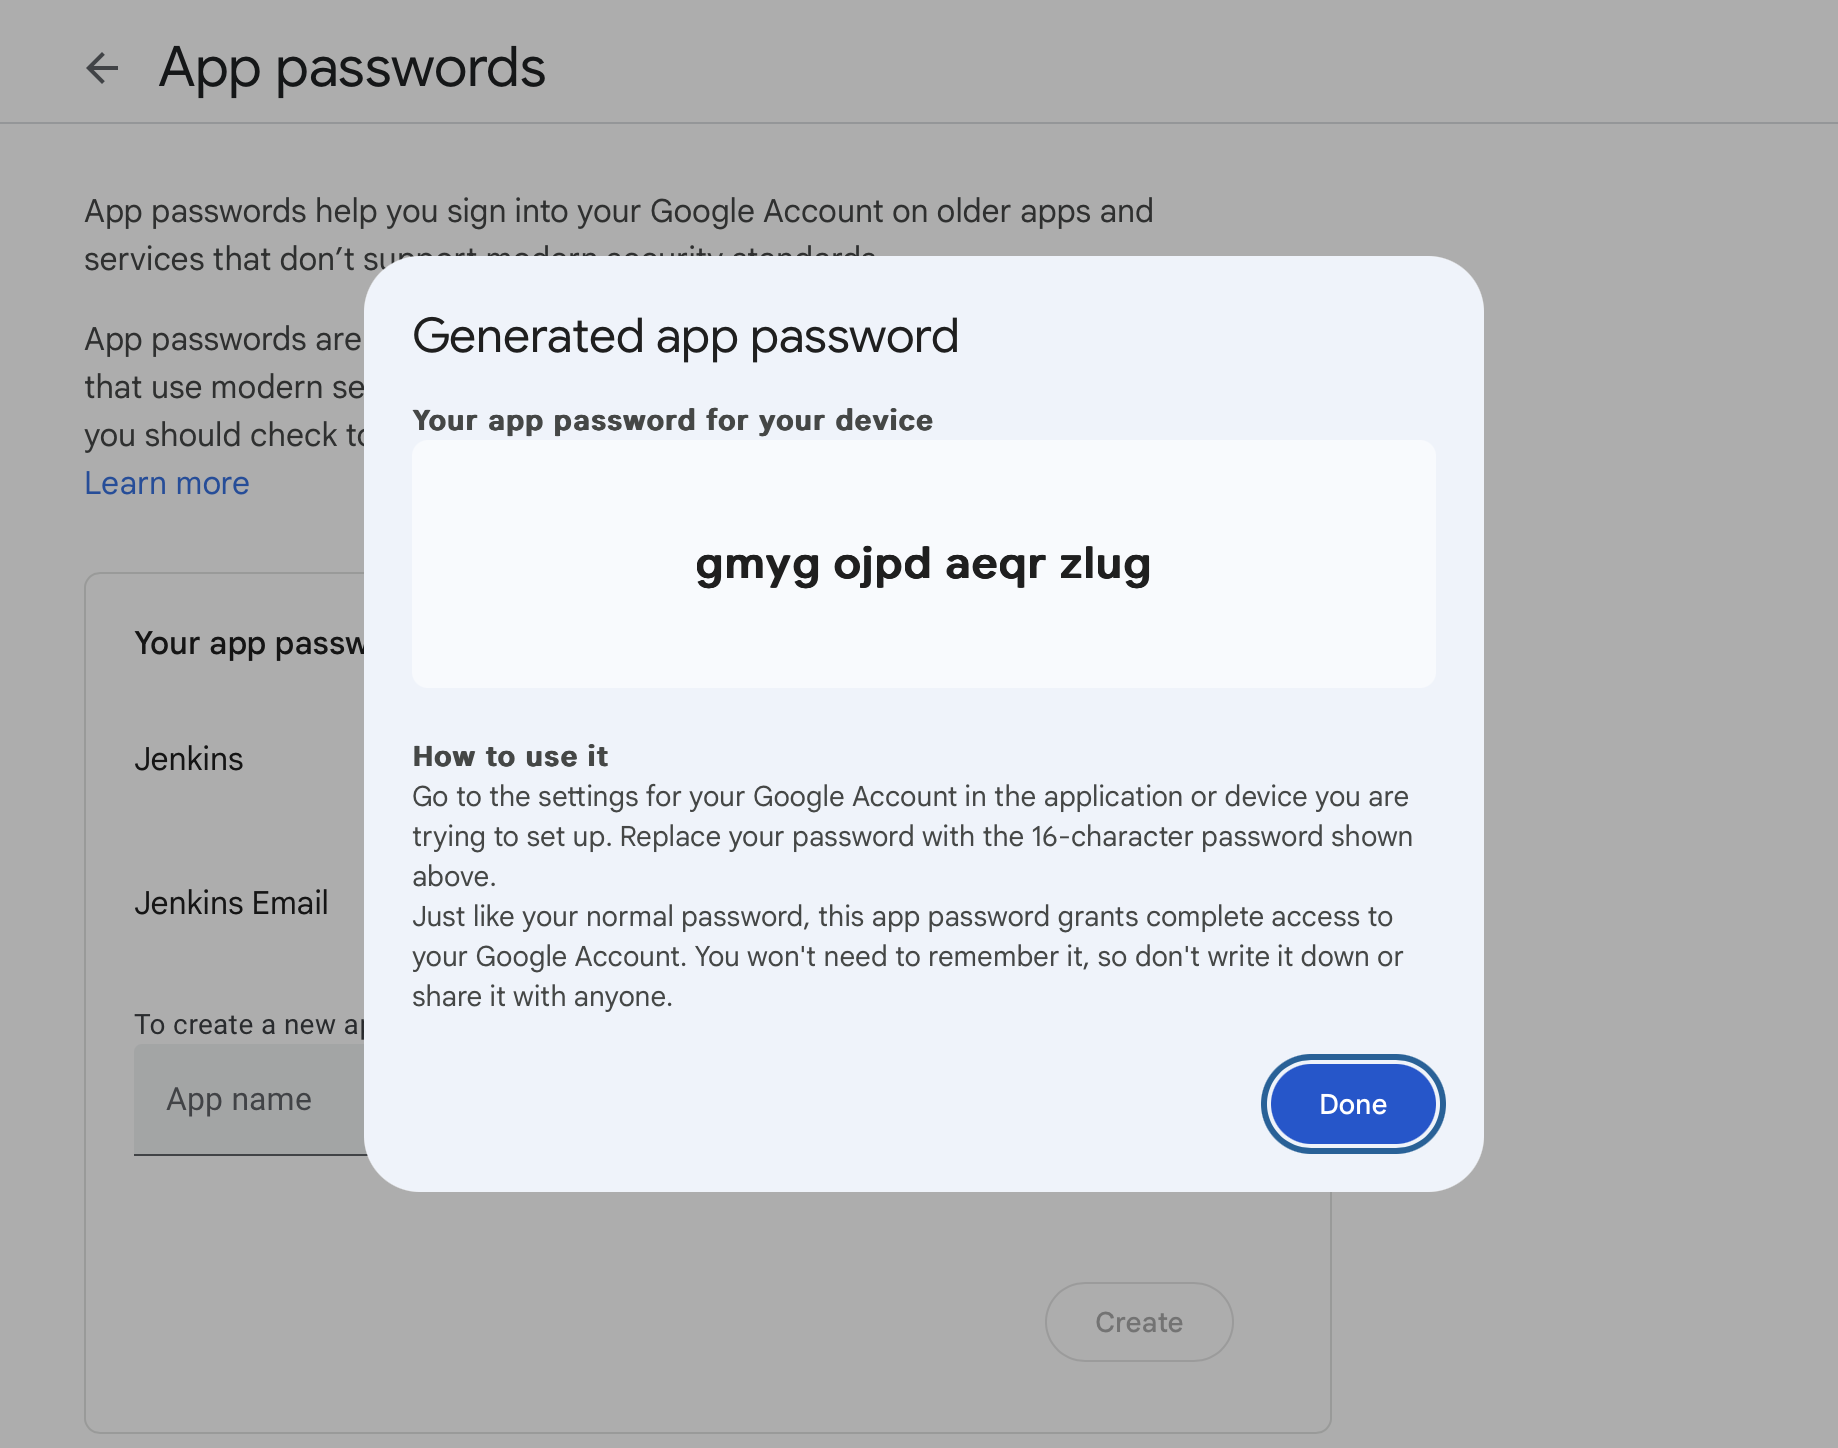
- Copy the 16-character password that appears
Use this App Password instead of your regular Gmail password when configuring the email settings in Jenkins.
Step 16: Email Integration with Jenkins
To set up email integration with Jenkins, follow these steps:
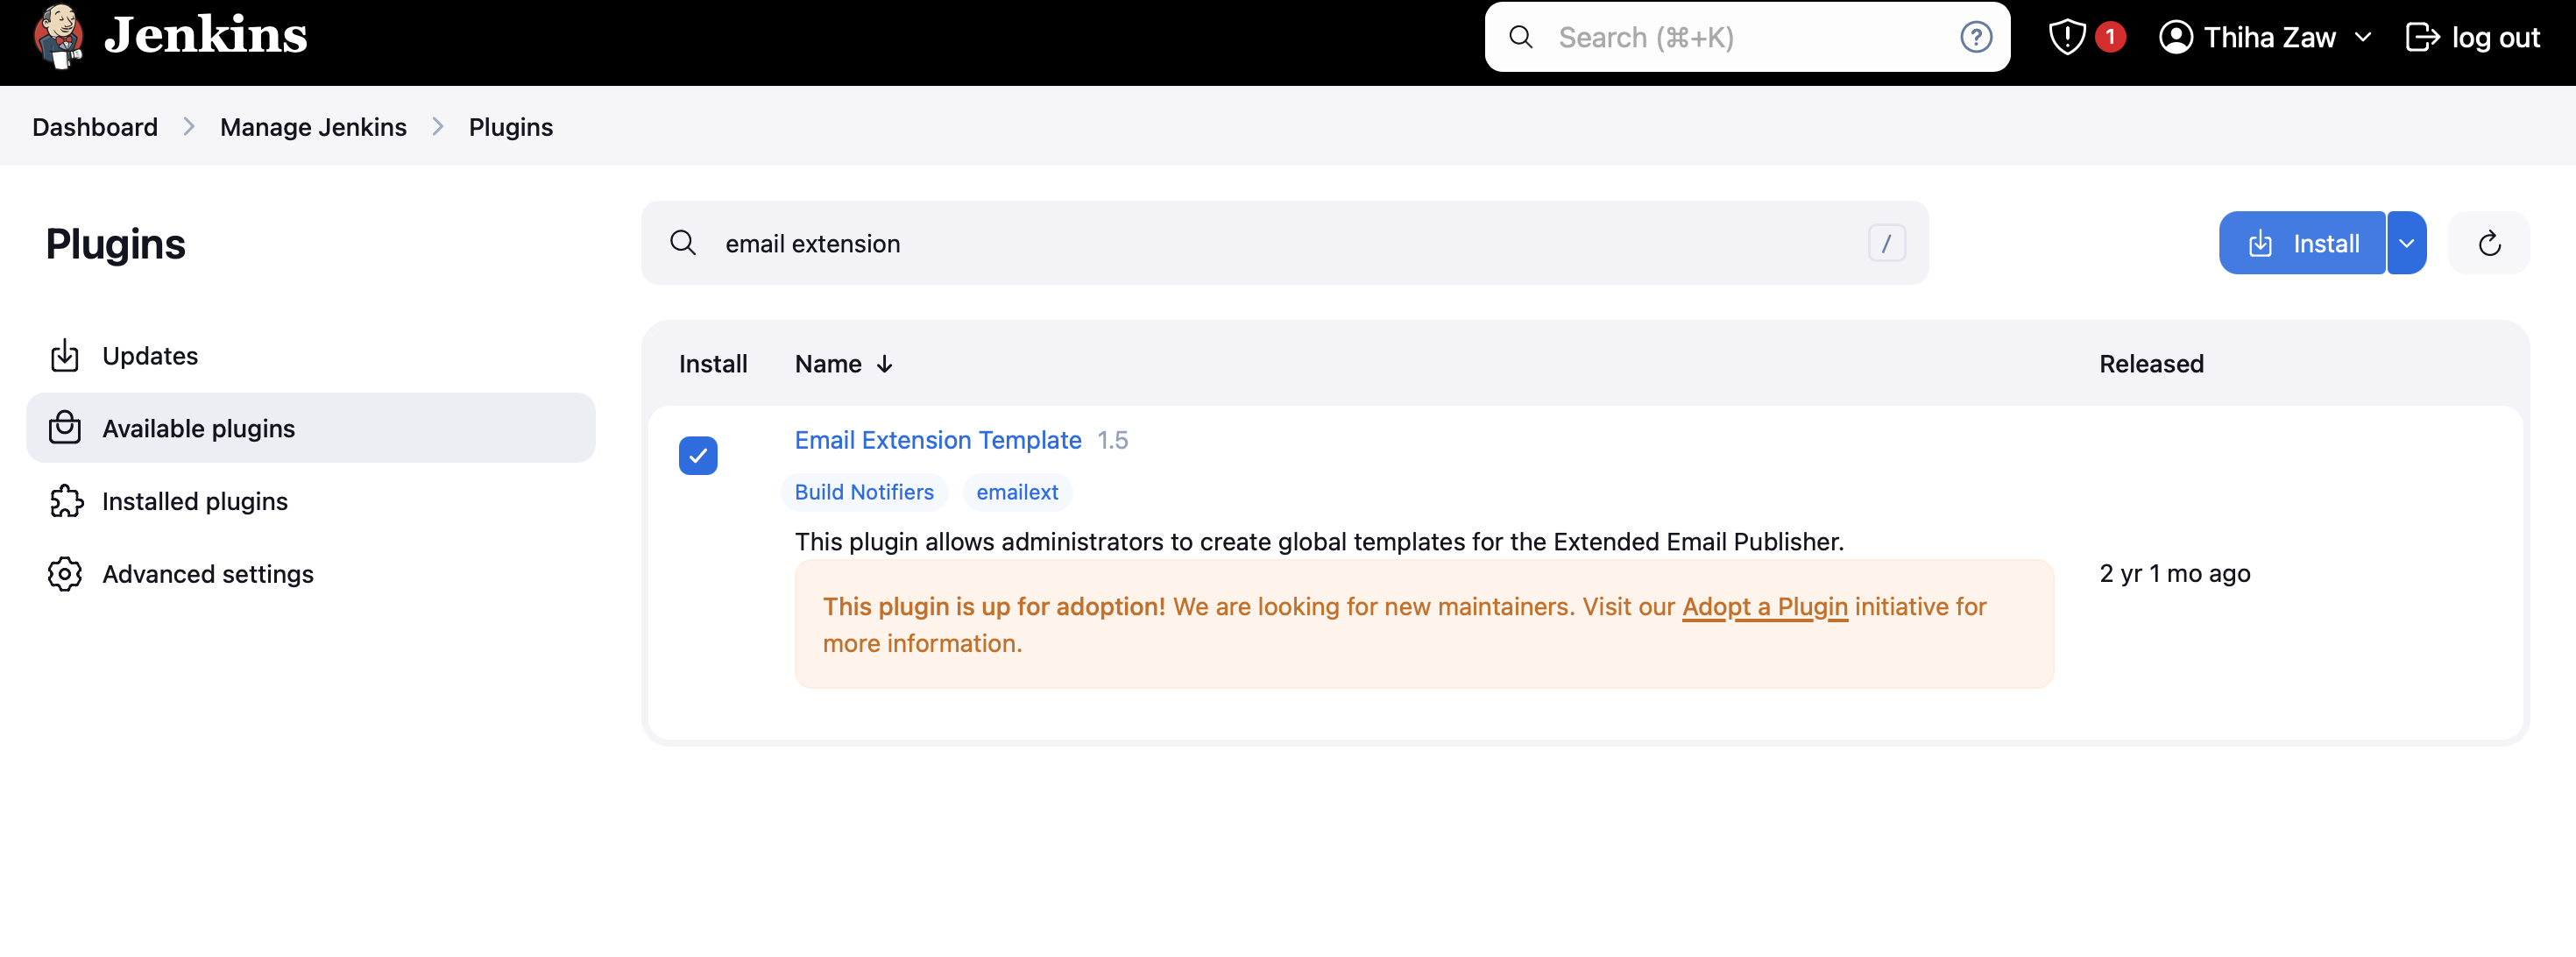
1. Install Email Extension Plugin
- Go to "Manage Jenkins" > "Manage Plugins"
- Click on the "Available" tab and search for "Email Extension Template"
2. Configure Jenkins System Settings
- Go to "Manage Jenkins" > "Configure System"
- Scroll down to the "E-mail Notification" section
- Enter your SMTP server details (e.g., smtp.gmail.com for Gmail)
- Enter the SMTP port (e.g., 465 for TLS)
- Check "Use SMTP Authentication" and enter your email credentials (Insert the app password generated above)
- Check "Use SSL" if required by your SMTP server
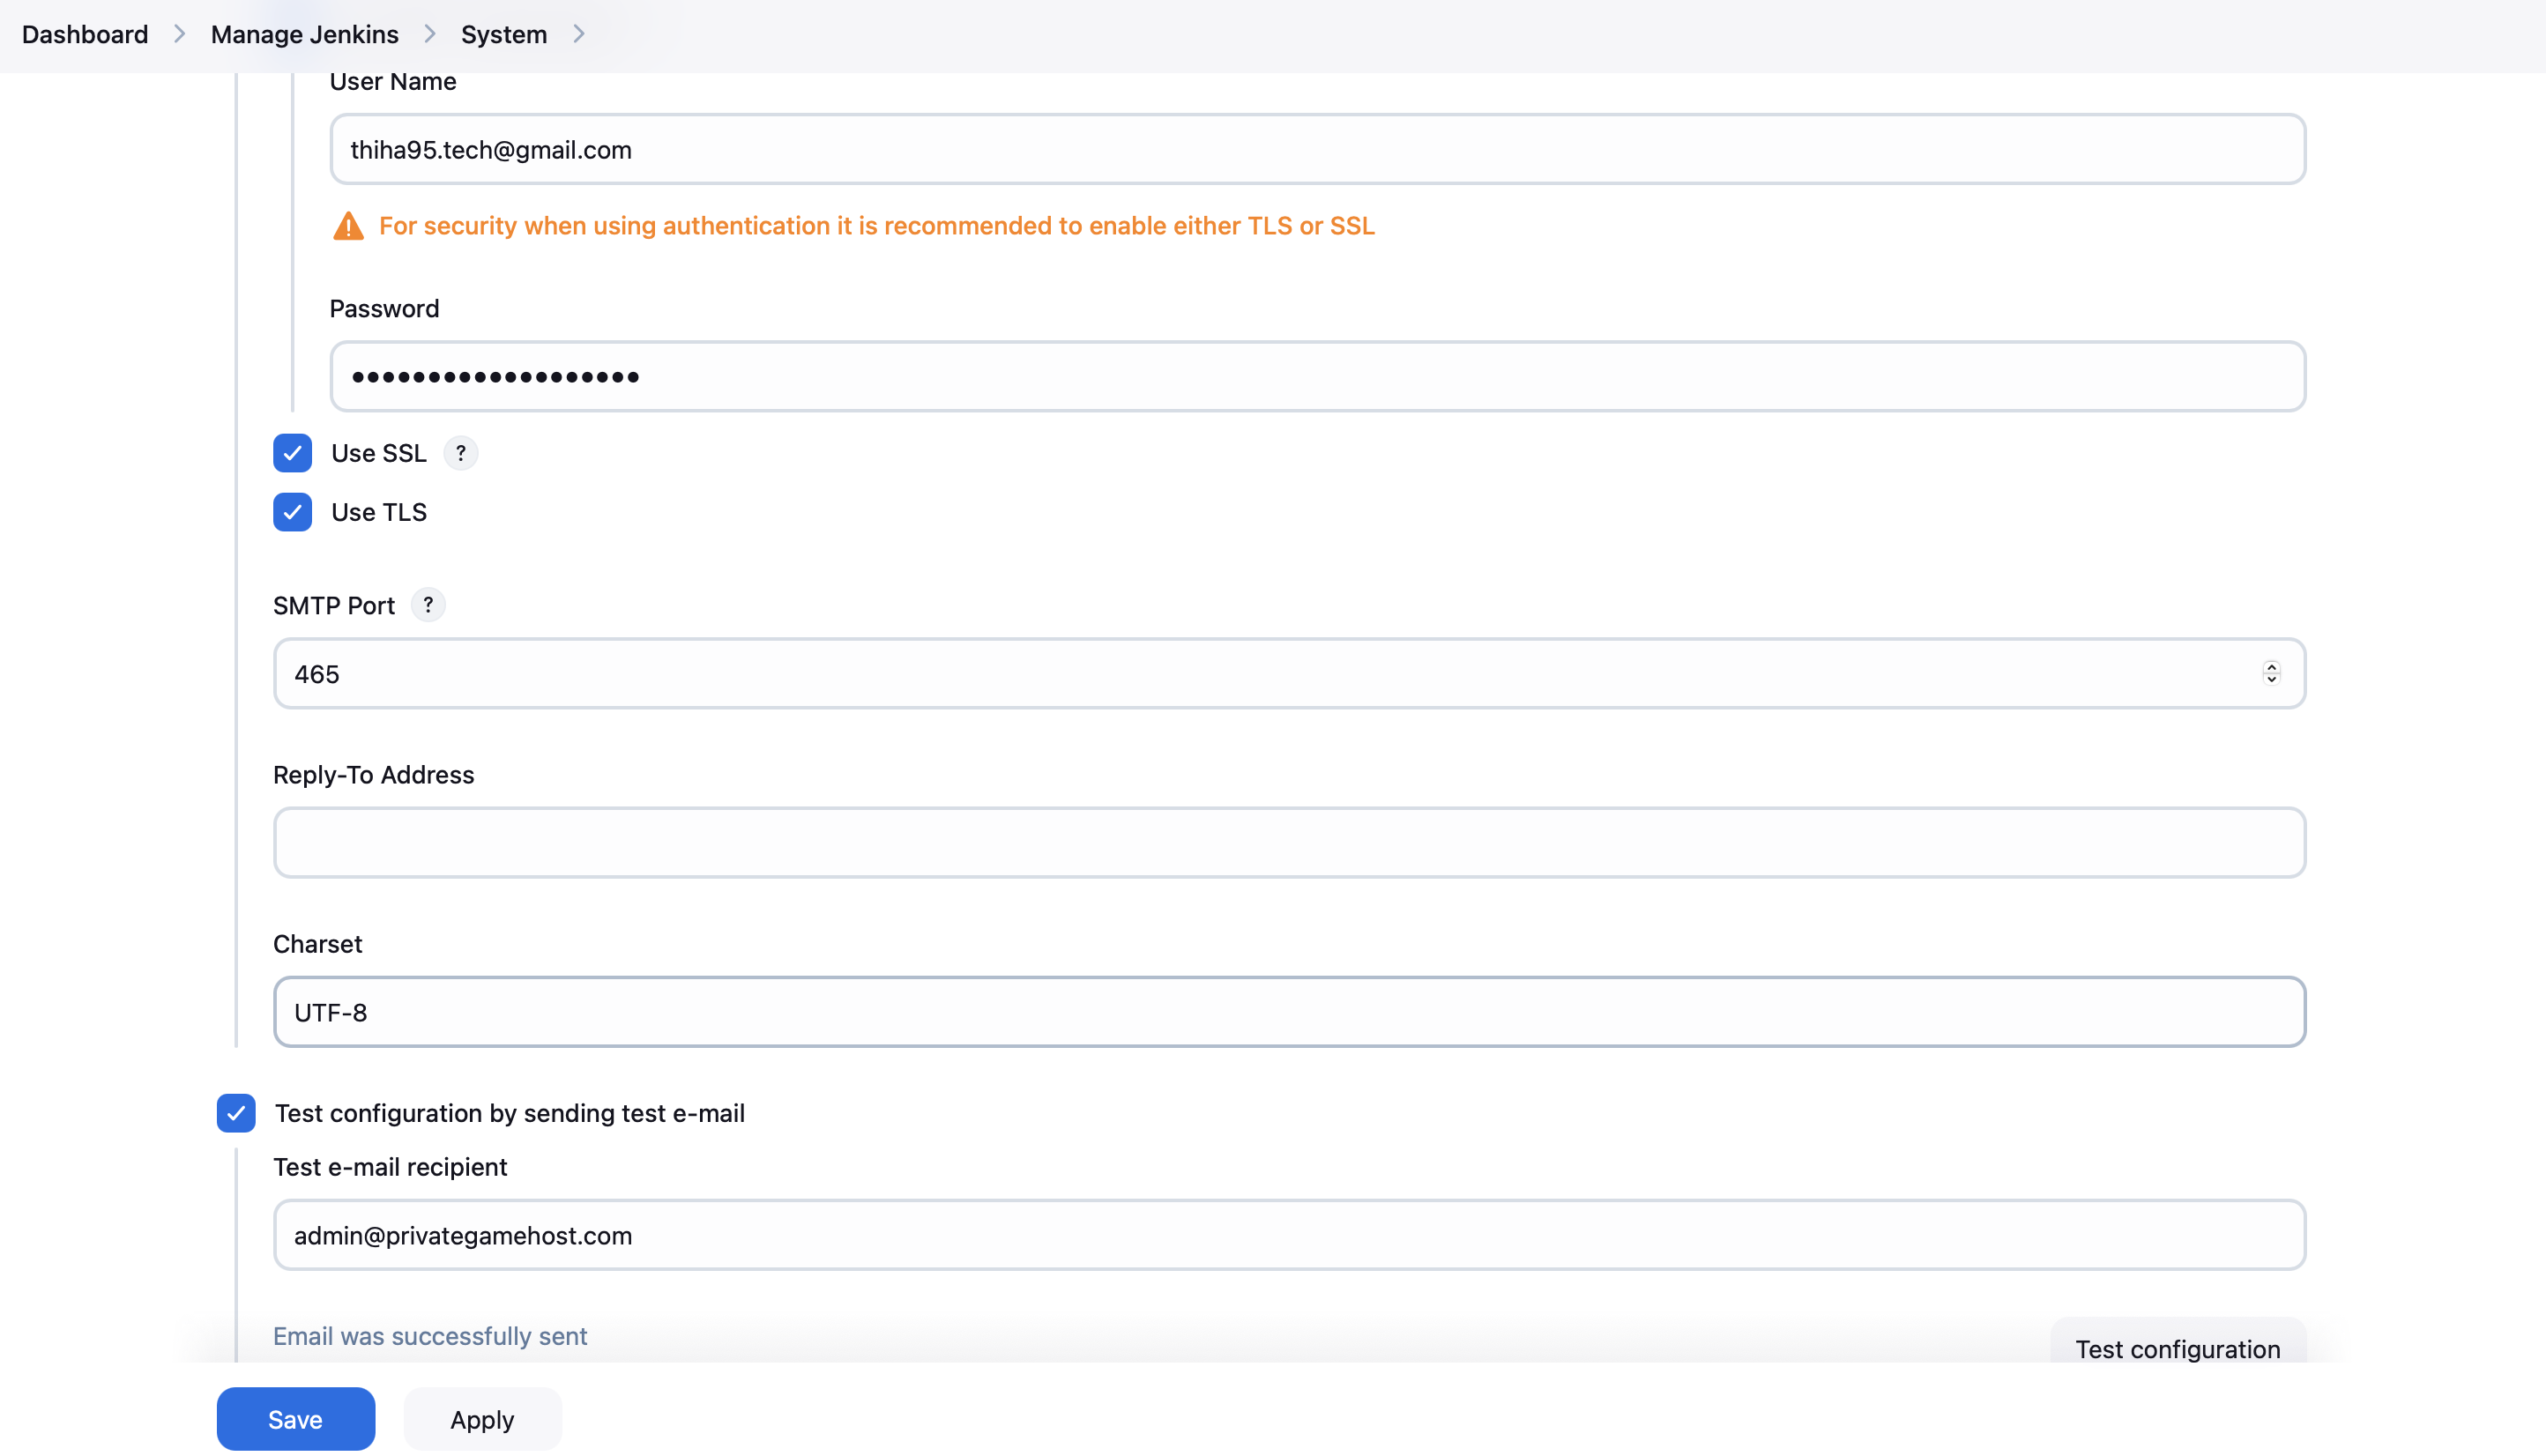
- Click "Test configuration" to ensure it's working correctly
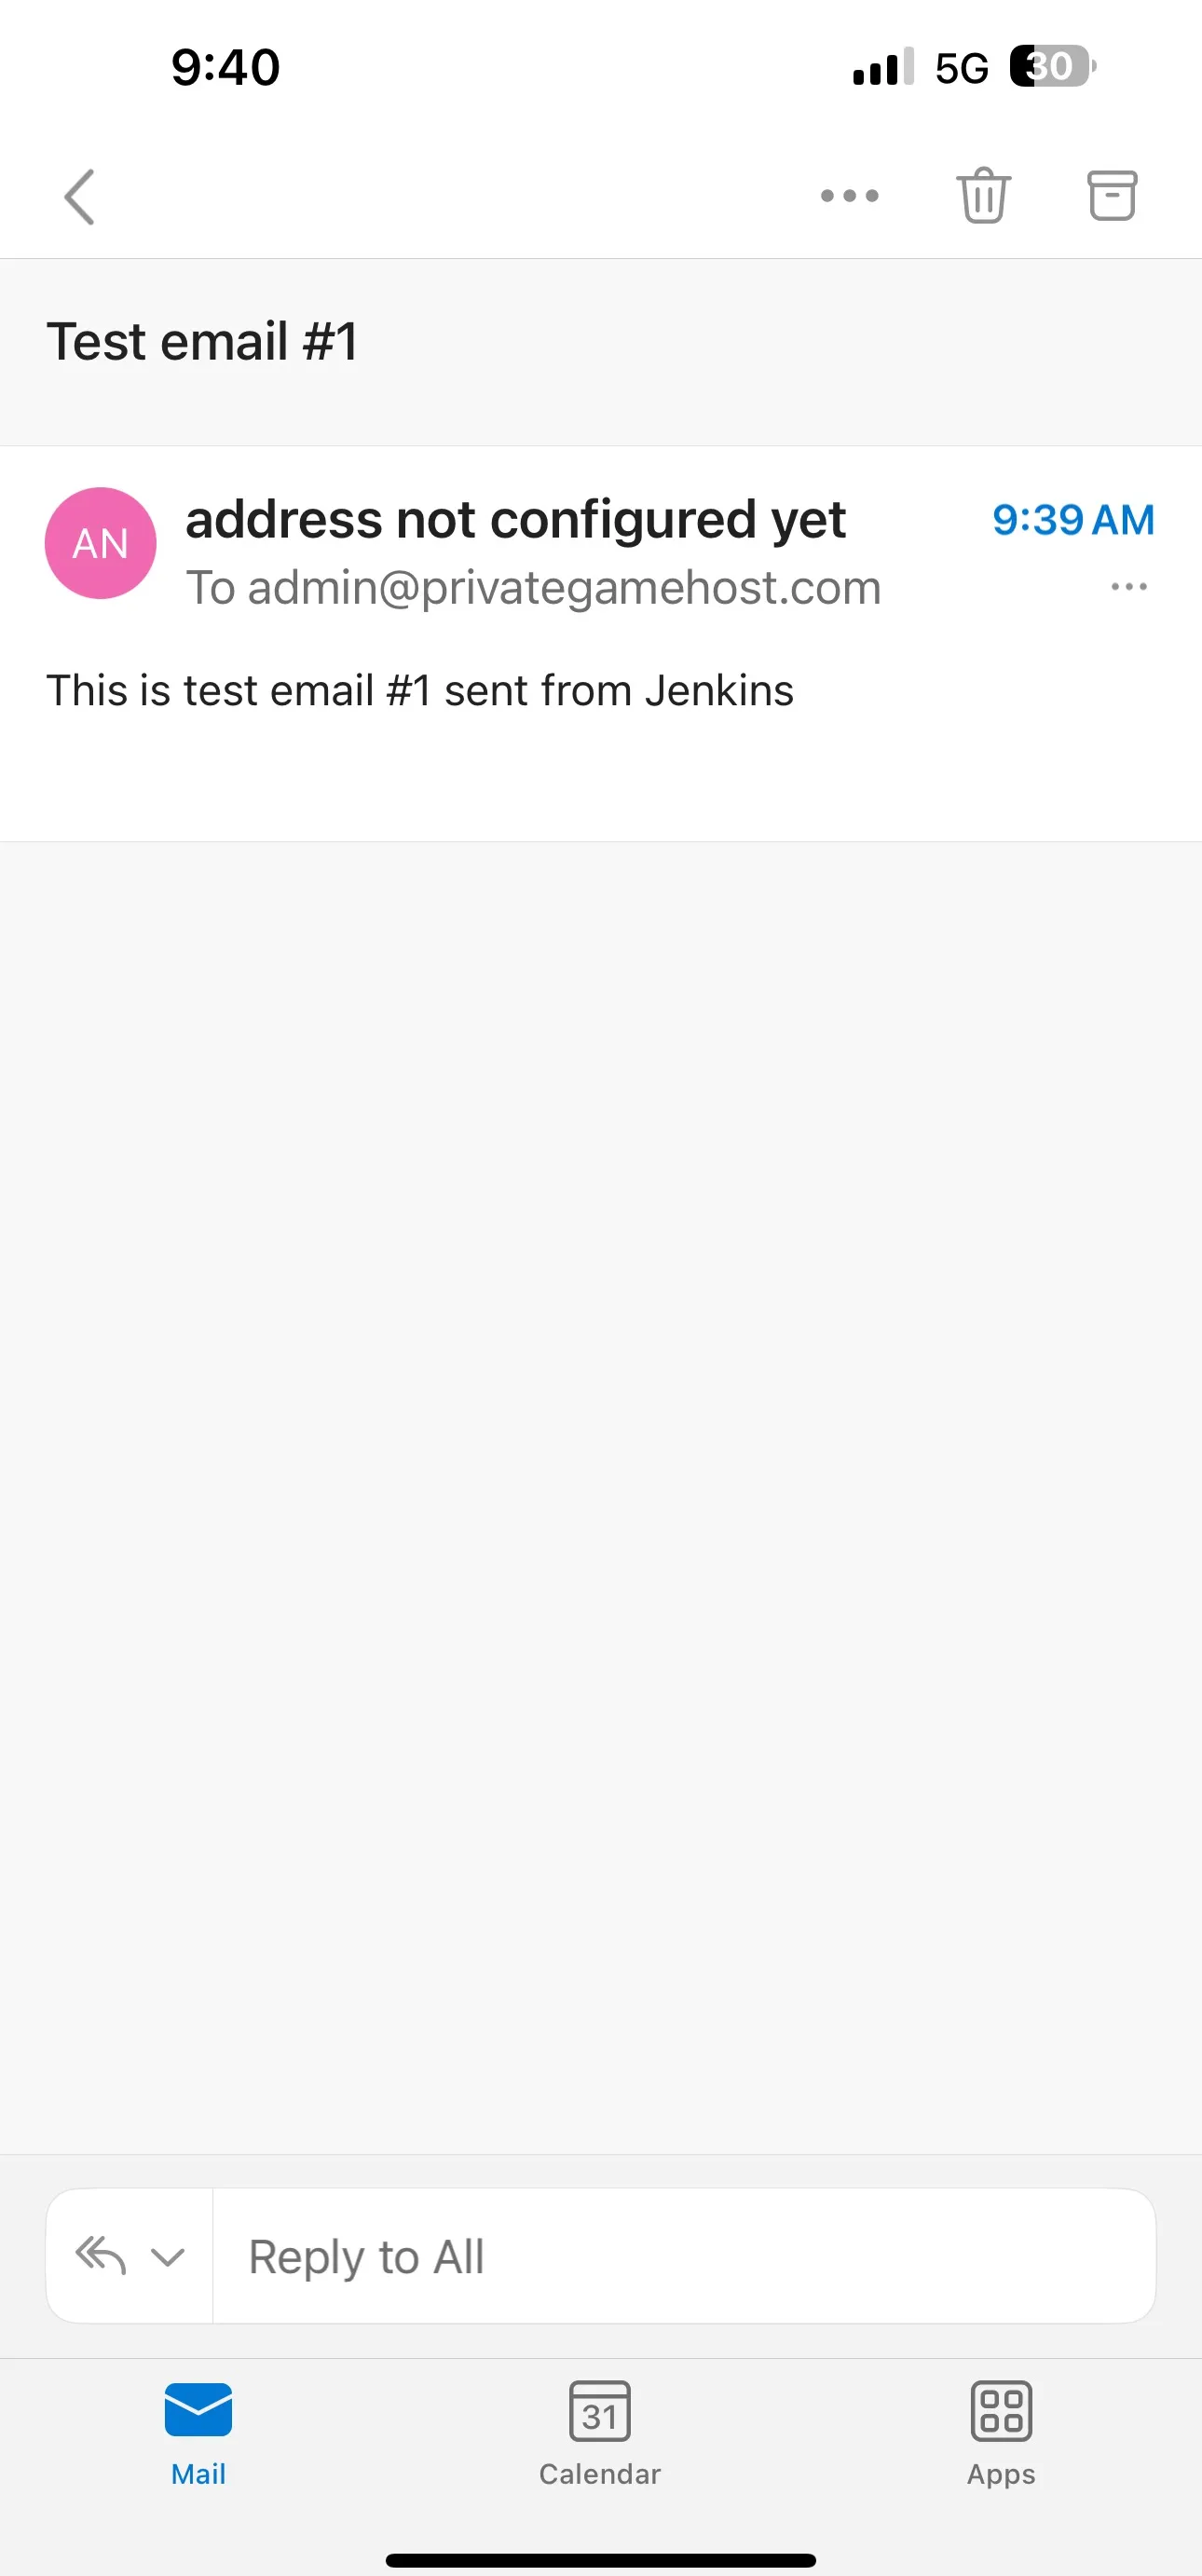
3. Configure Extended E-mail Notification
- In the same "Configure System" page, scroll to "Extended E-mail Notification"
- Set the SMTP server, port, and credentials (can be the same as above)
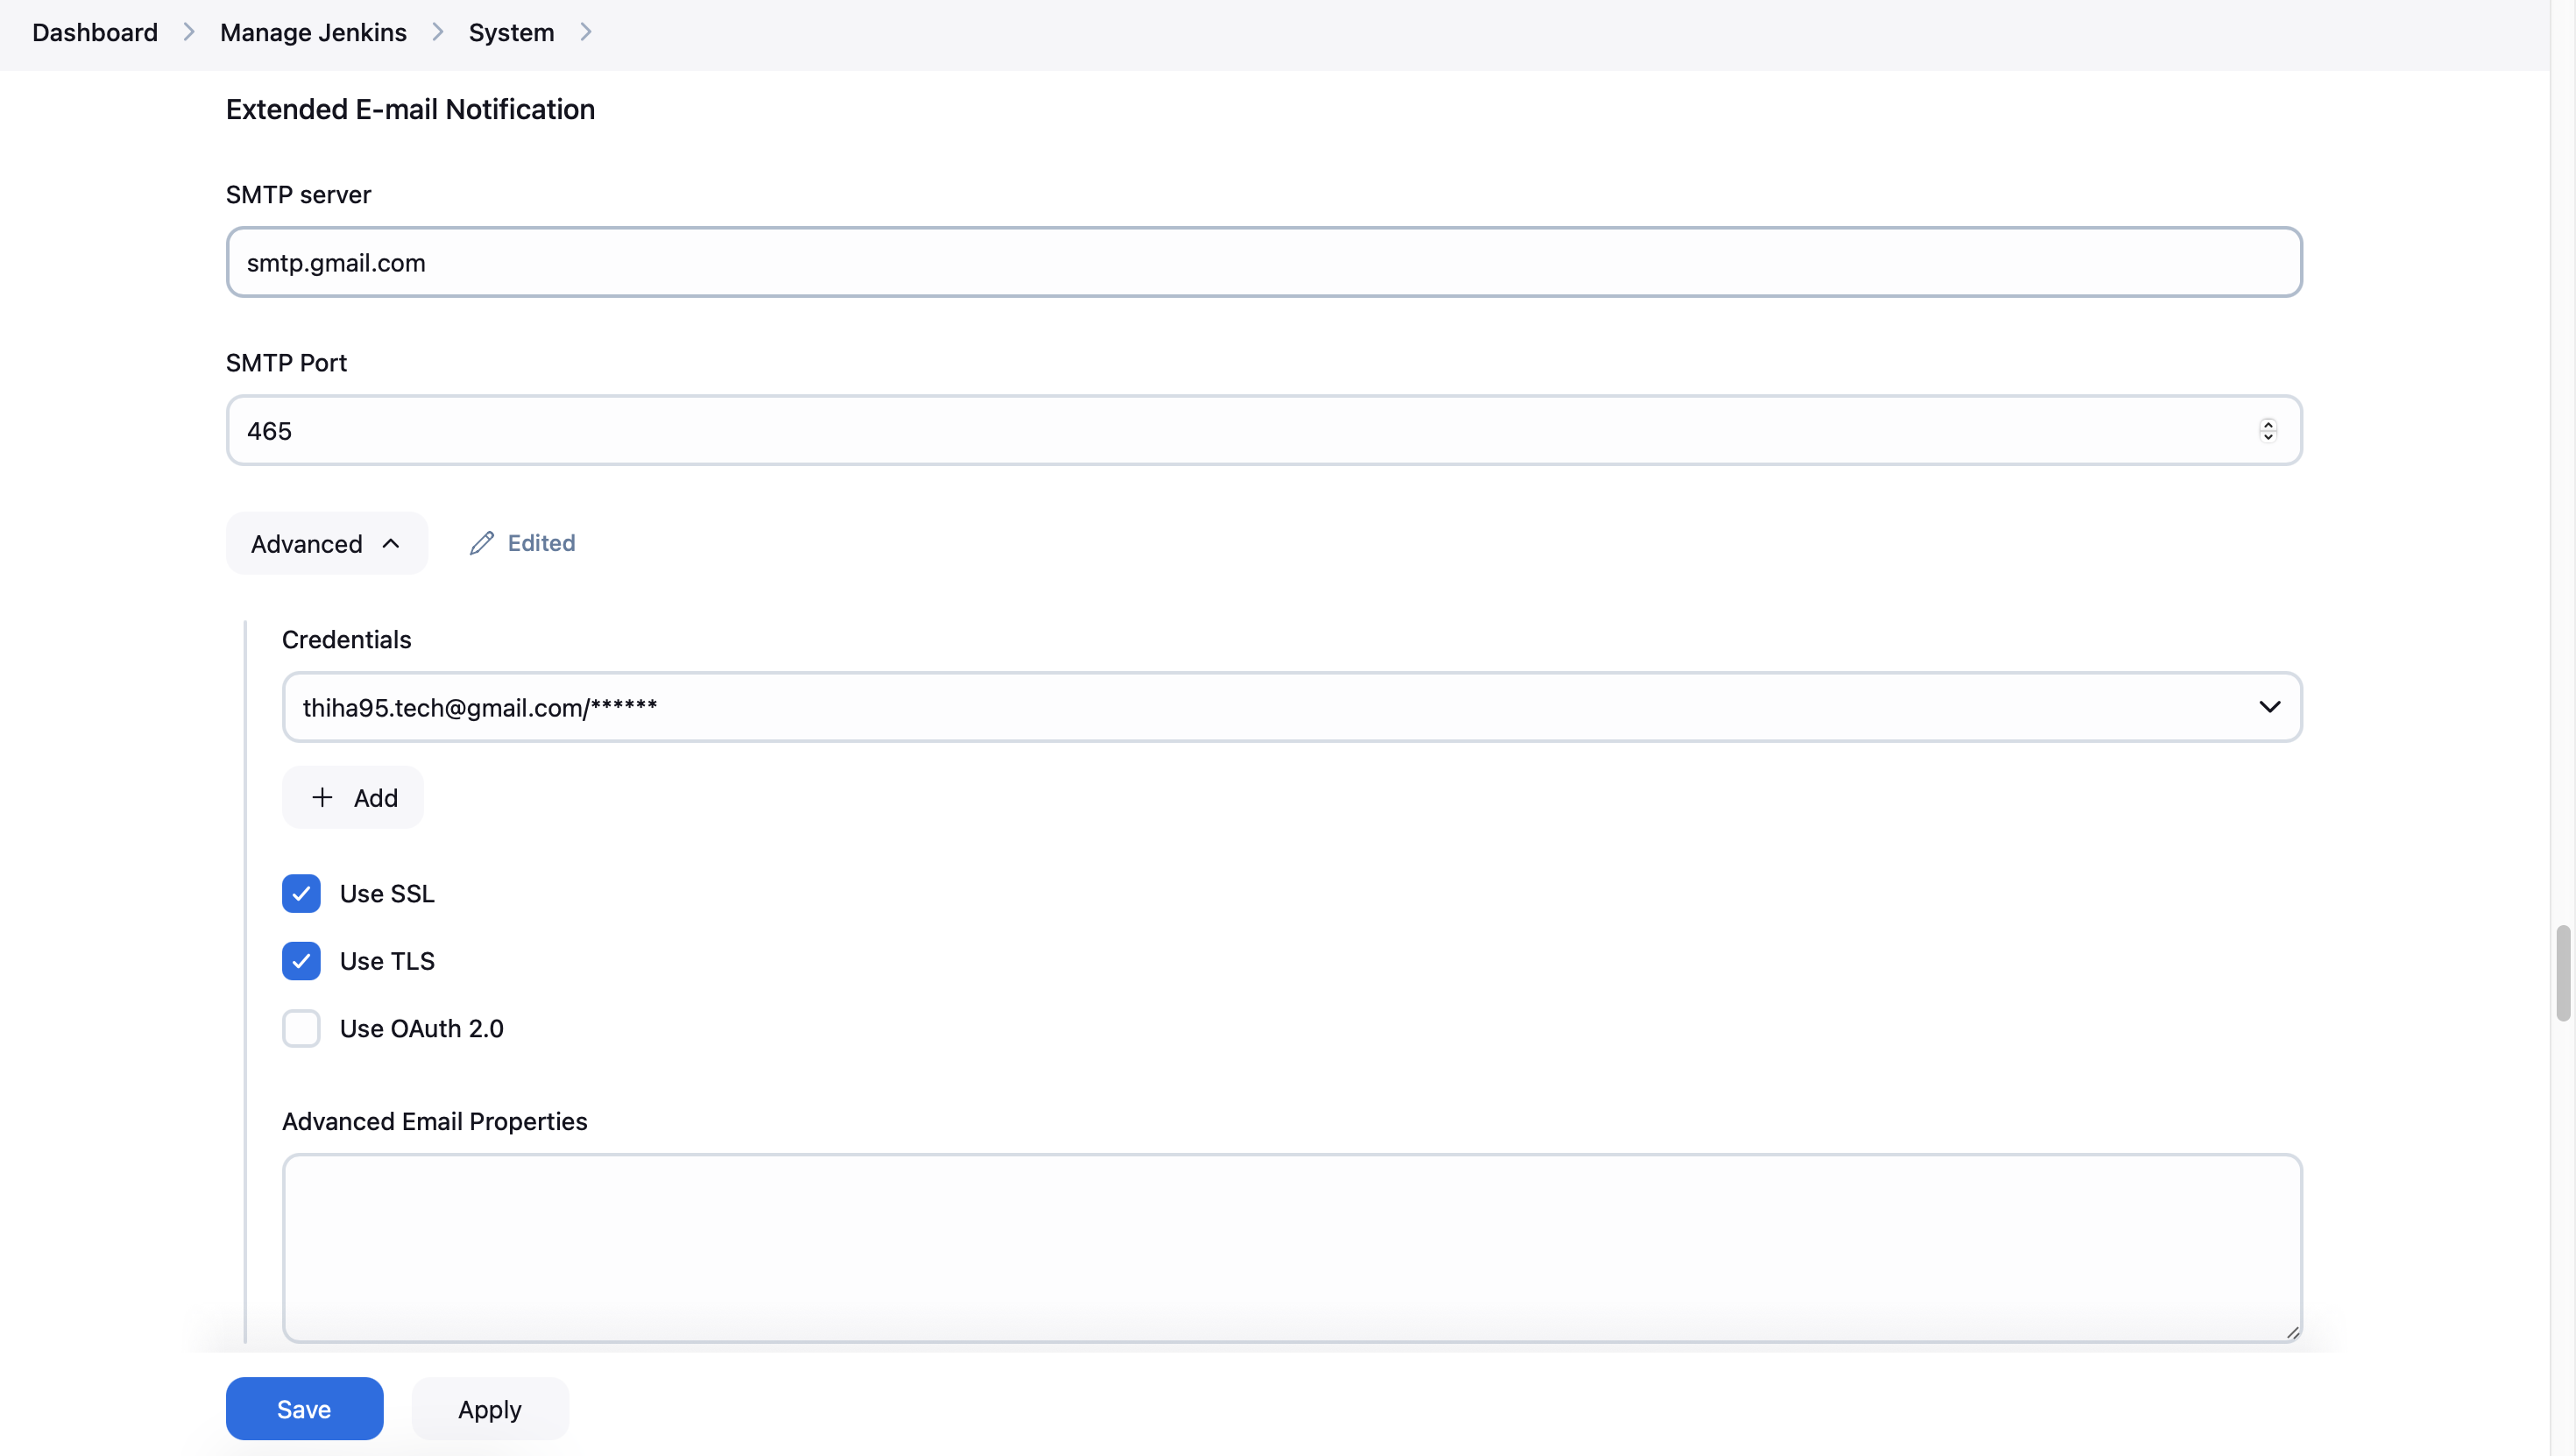
- Set a default recipient list if desired
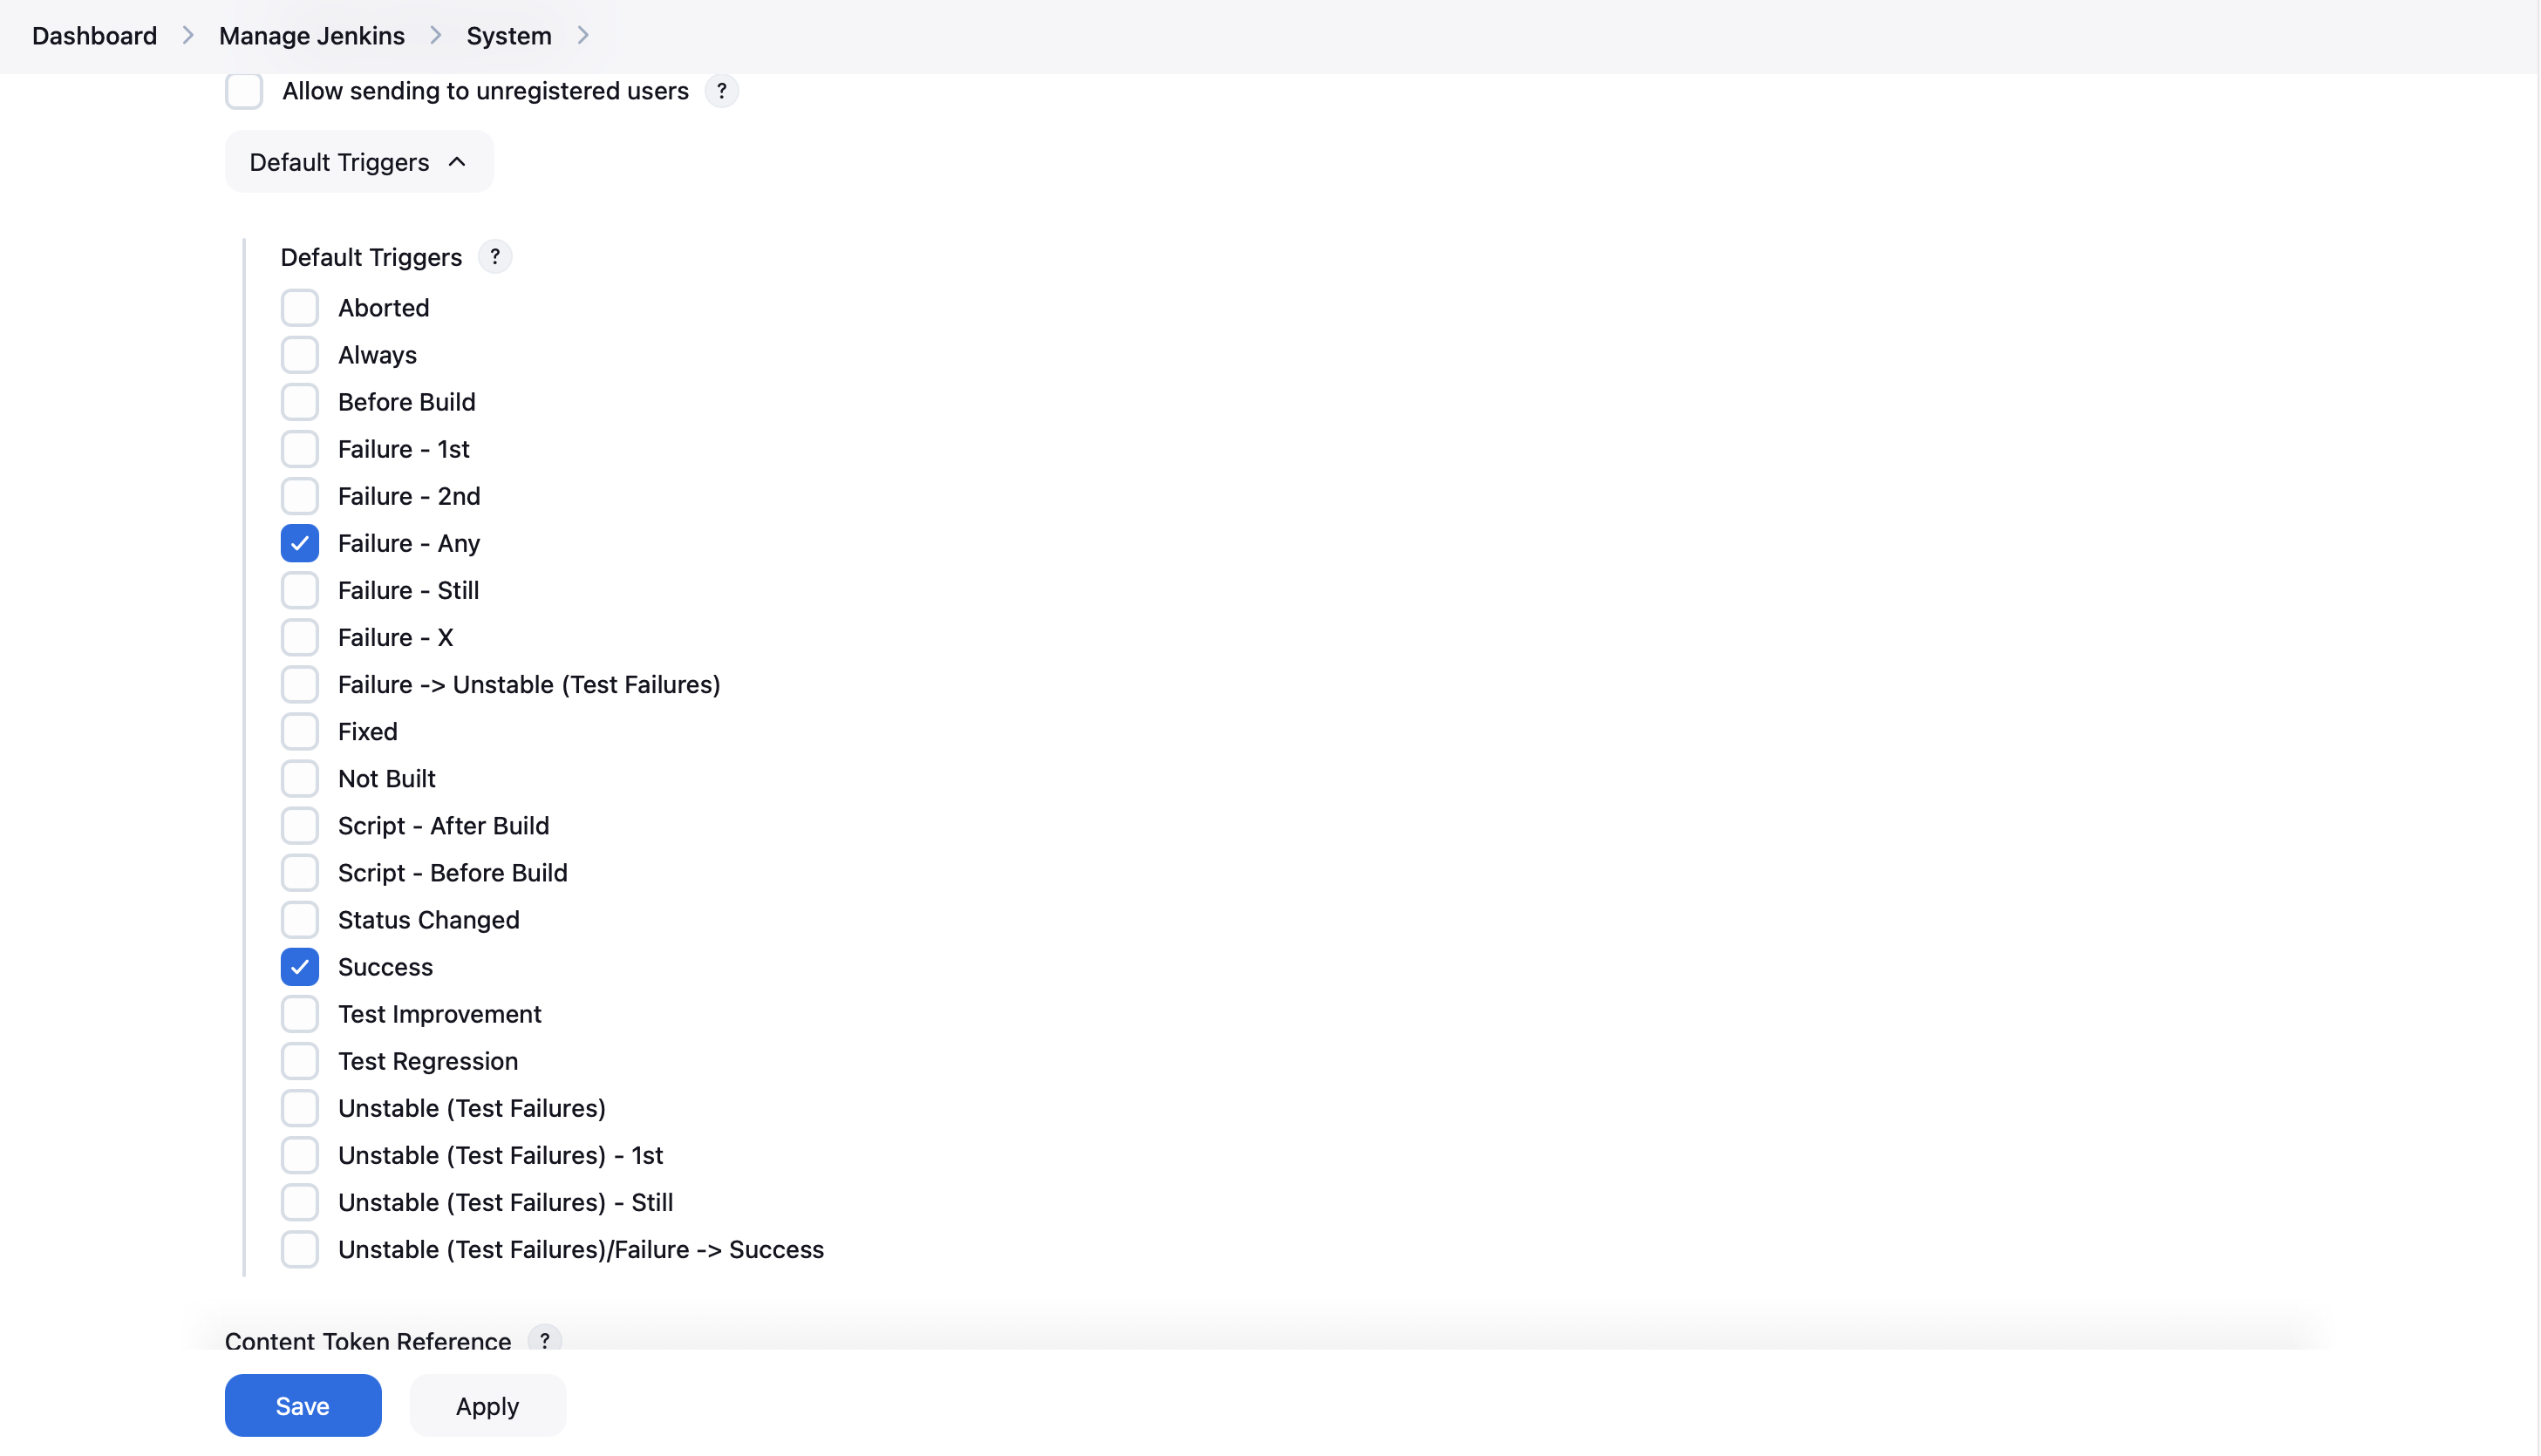
- Configure other settings like "Default Content Type" and "Default Subject"
- For triggers, you can set any you like.
4. Update Jenkins Pipeline
Update your Jenkinsfile to include email notifications. Here's an example of how to modify the post section:
post {
    always {
        emailext attachLog: true,
            subject: "'${currentBuild.result}: Build #${env.BUILD_NUMBER} for ${env.JOB_NAME}'",
            body: """
                <h2>Build Notification</h2>
                <p><strong>Project:</strong> ${env.JOB_NAME}</p>
                <p><strong>Build Number:</strong> ${env.BUILD_NUMBER}</p>
                <p><strong>Status:</strong> ${currentBuild.result}</p>
                <p><strong>Build URL:</strong> <a href="${env.BUILD_URL}">${env.BUILD_URL}</a></p>
                <p>For more details, please check the attached logs.</p>
            """,
            to: '[email protected]',
            attachmentsPattern: 'trivyfs.txt,trivyimage.txt,trivyimage2.txt'
        }
    }
This configuration will send an email after each build, including build status, job name, build number, and a link to the console output. Adjust the recipient email and other details as needed for your project.
5. Test the Email Integration
Run a build of your pipeline to test if the email notifications are working correctly. You should receive an email with the build status and details after the pipeline completes.
By following these steps, you'll have successfully integrated email notifications into your Jenkins pipeline, keeping your team informed about build statuses and results.
Step 17: Install Required Jenkins Plugins
To enhance our Jenkins pipeline, we need to install several important plugins. Follow these steps to install the required plugins:
- Navigate to "Manage Jenkins" > "Manage Plugins"
- Click on the "Available" tab
- Use the search box to find and select the following plugins:
- JDK Tool Plugin (jdk - 17, adoptium.net)
- NodeJS Plugin (NodeJS - 16)
- OWASP Dependency-Check Plugin
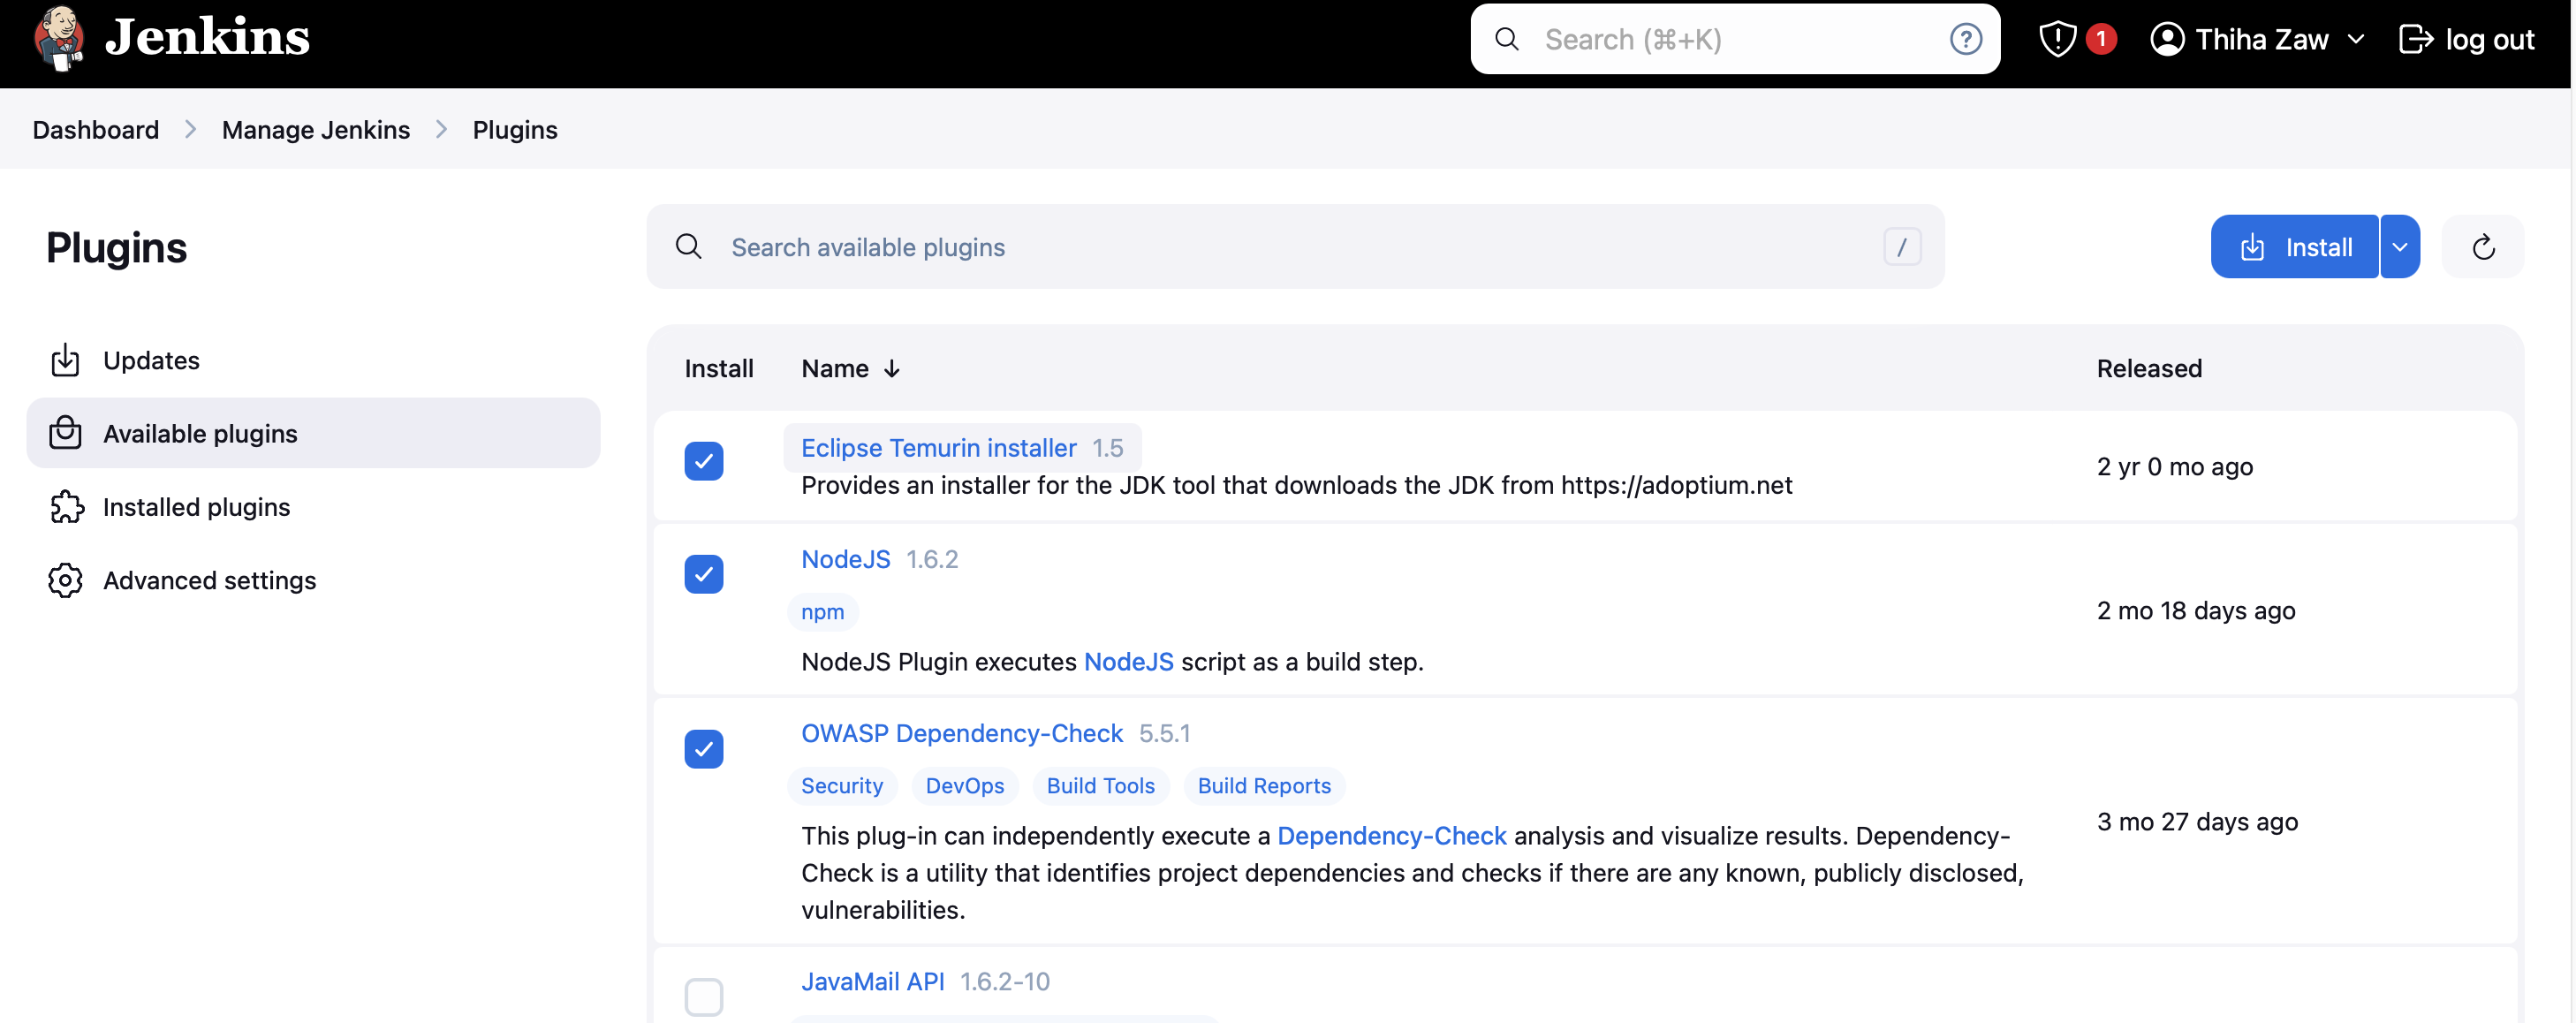
- Wait for the installation to complete
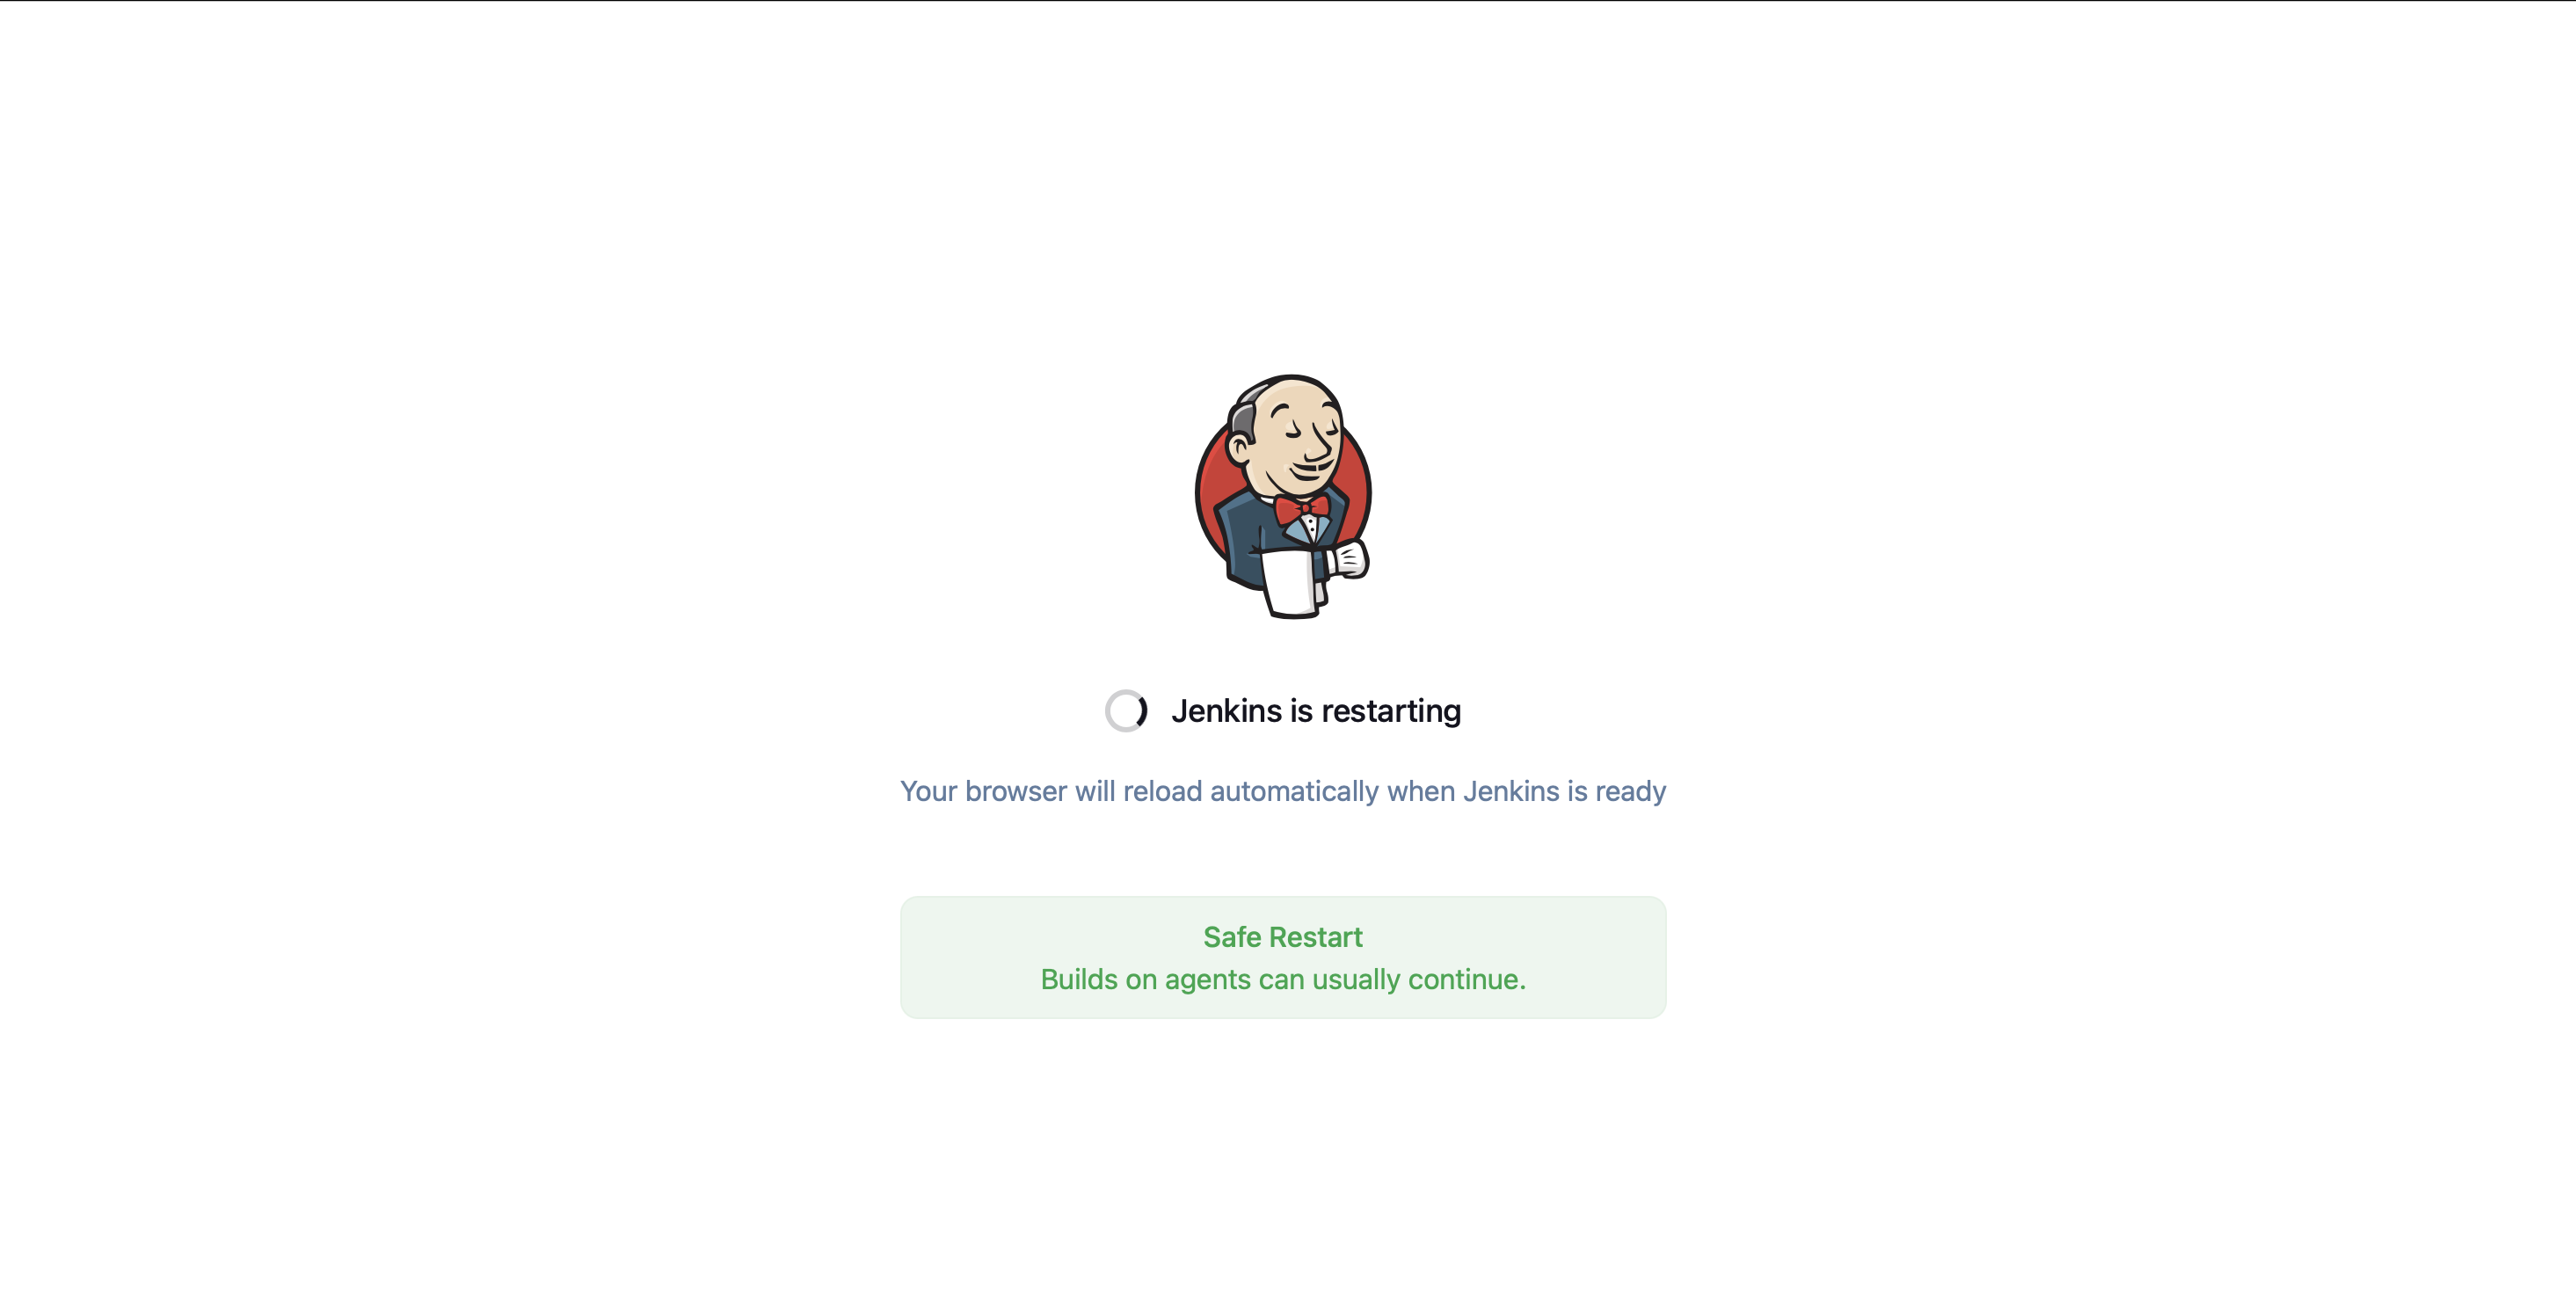
- Check the box that says "Restart Jenkins when installation is complete and no jobs are running"
After Jenkins restarts, log back in to configure the newly installed plugins.
Configure Installed Plugins
Once Jenkins has restarted, you'll need to configure the installed plugins:
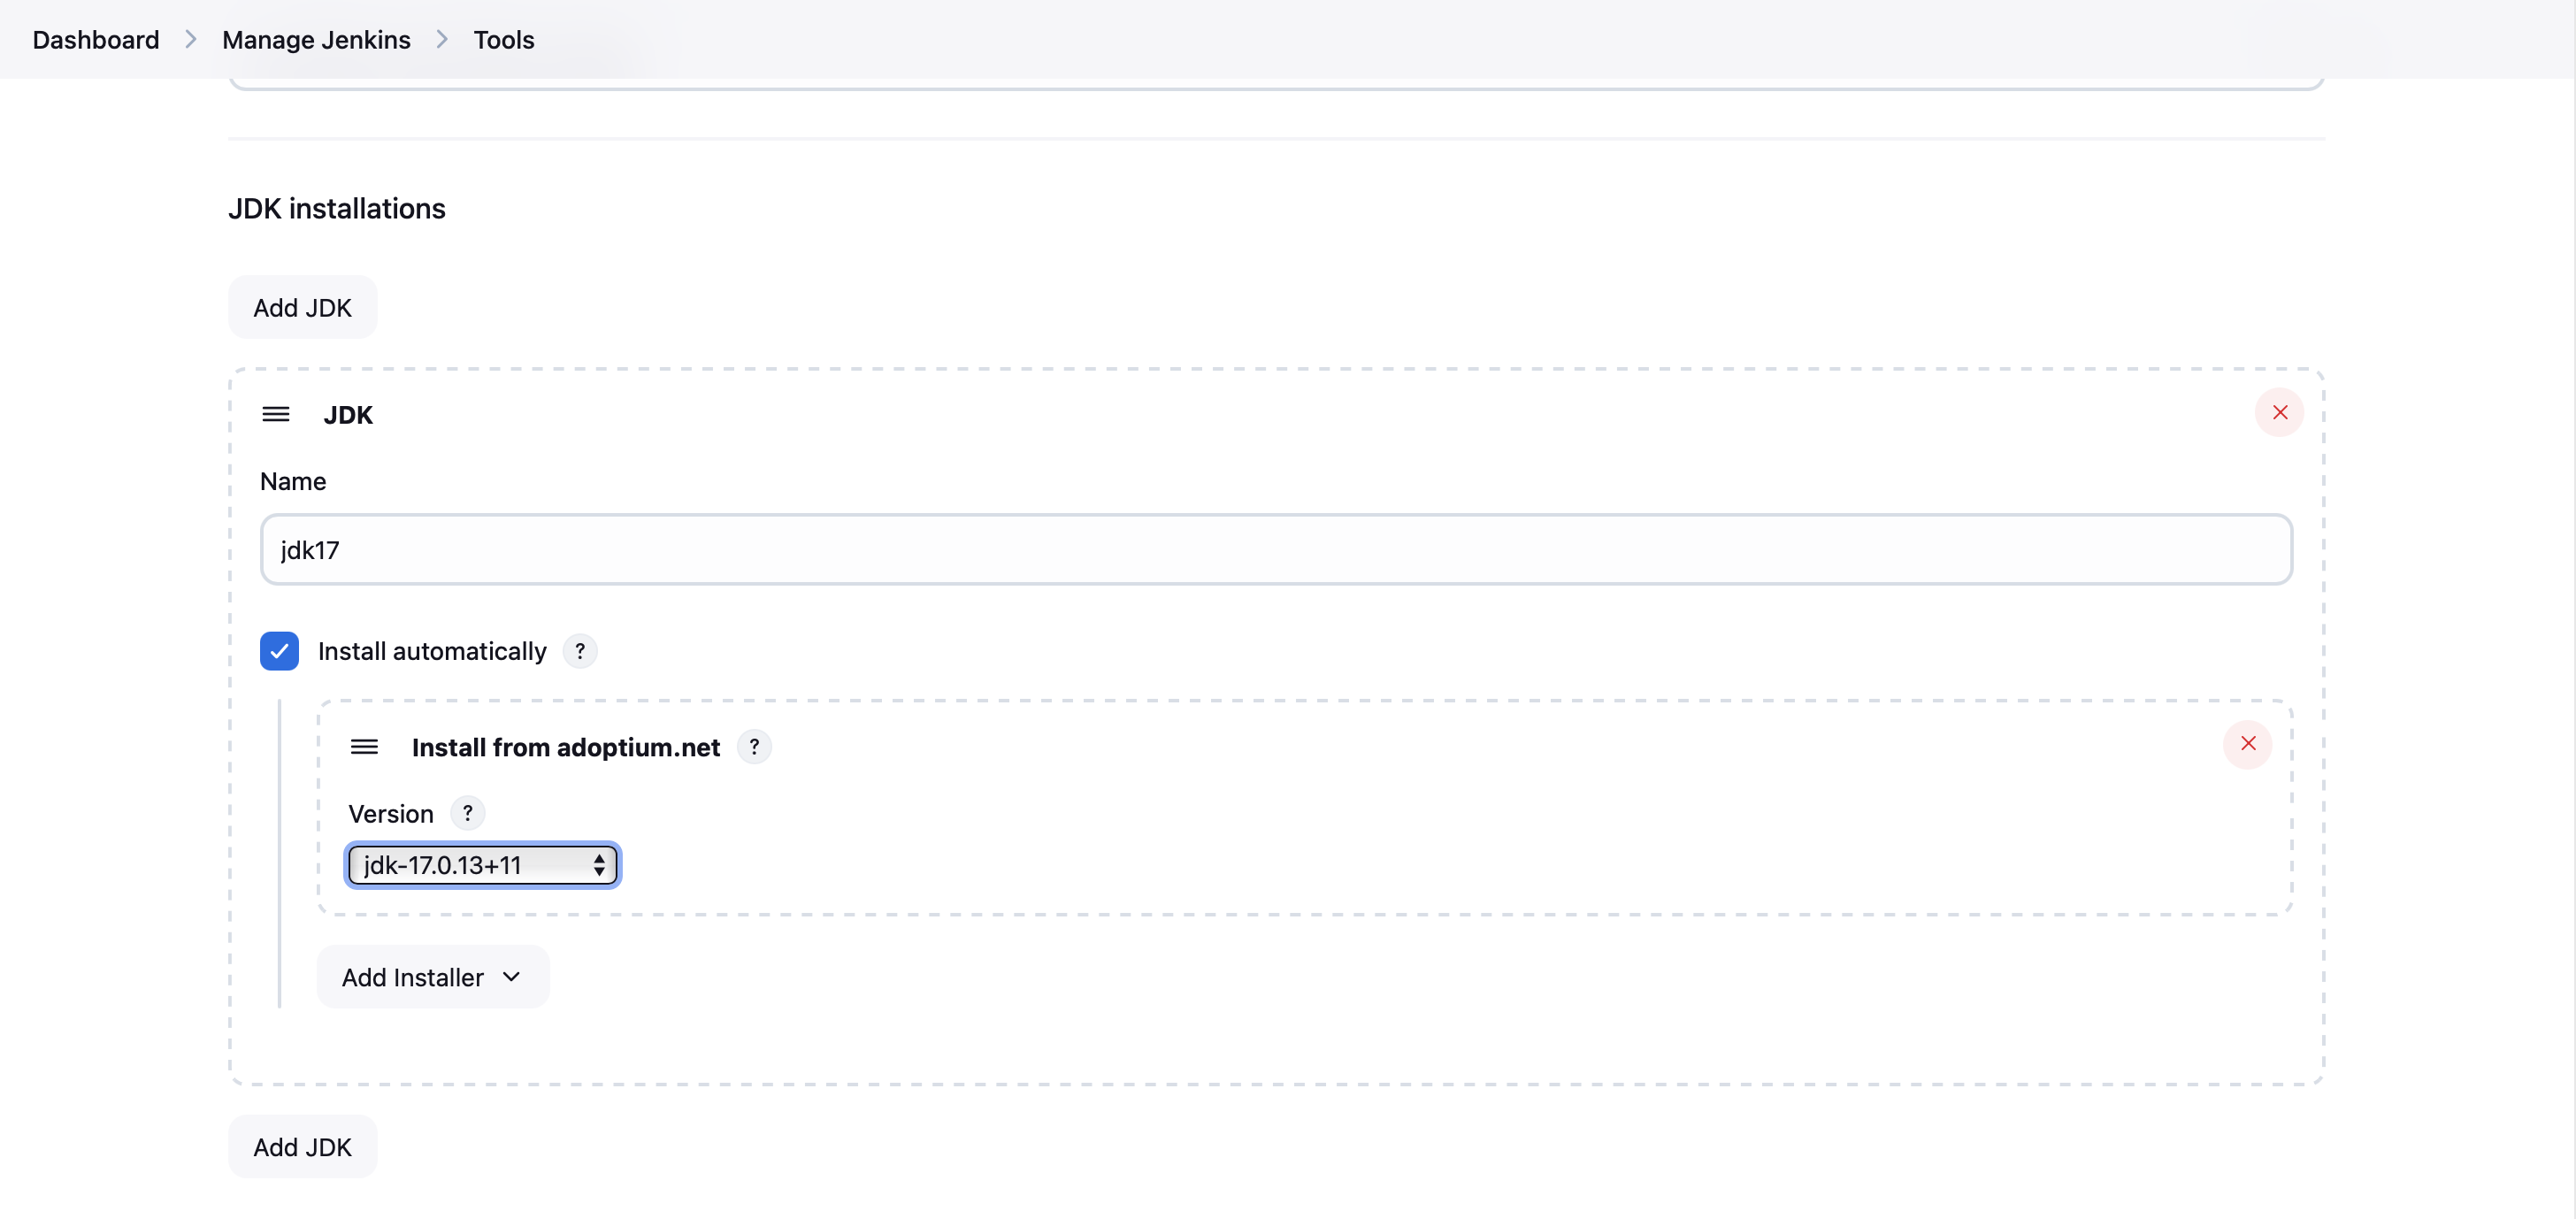
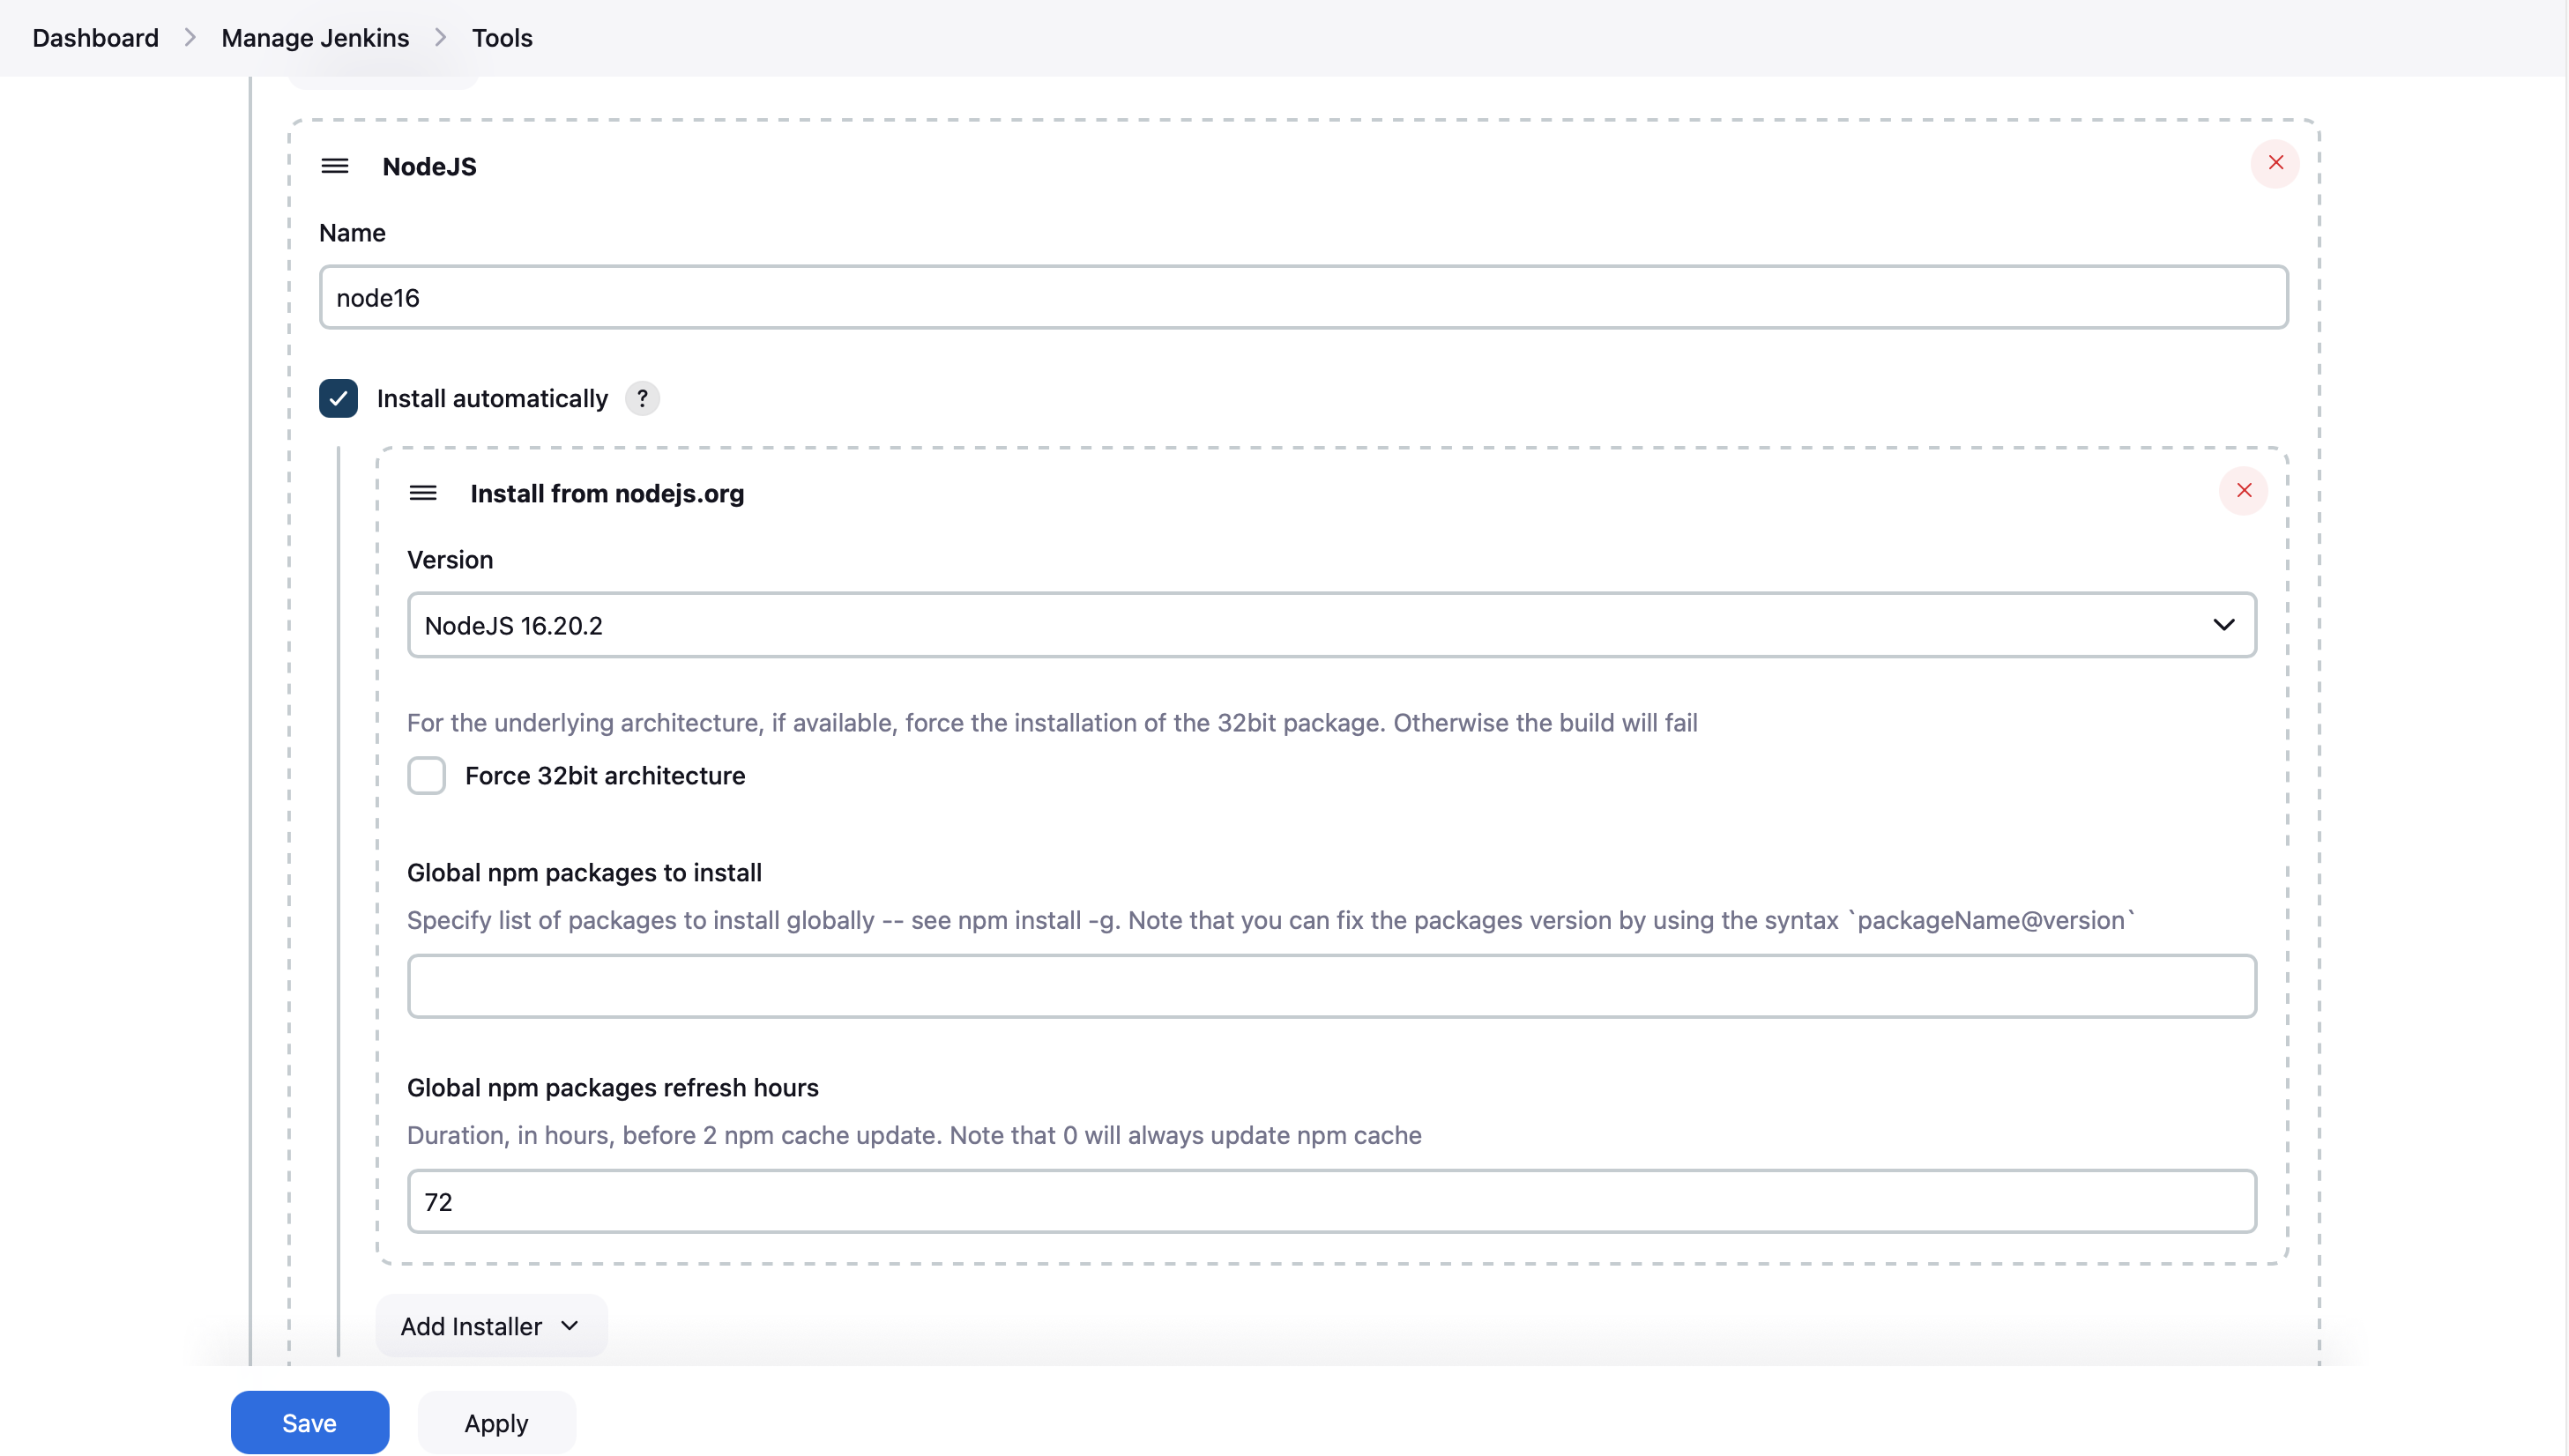
- Go to "Manage Jenkins" > "Tools"
- Scroll down to find sections for JDK, NodeJS, and SonarQube Scanner
- For each tool, click "Add {Tool Name}" and provide the necessary information:
- JDK: Provide a name and select the installation method (usually "Install automatically")
- NodeJS: Give it a name and choose the version you want to use
- For OWASP Dependency-Check, go to "Manage Jenkins" > "Tools" and add a new OWASP Dependency-Check installation
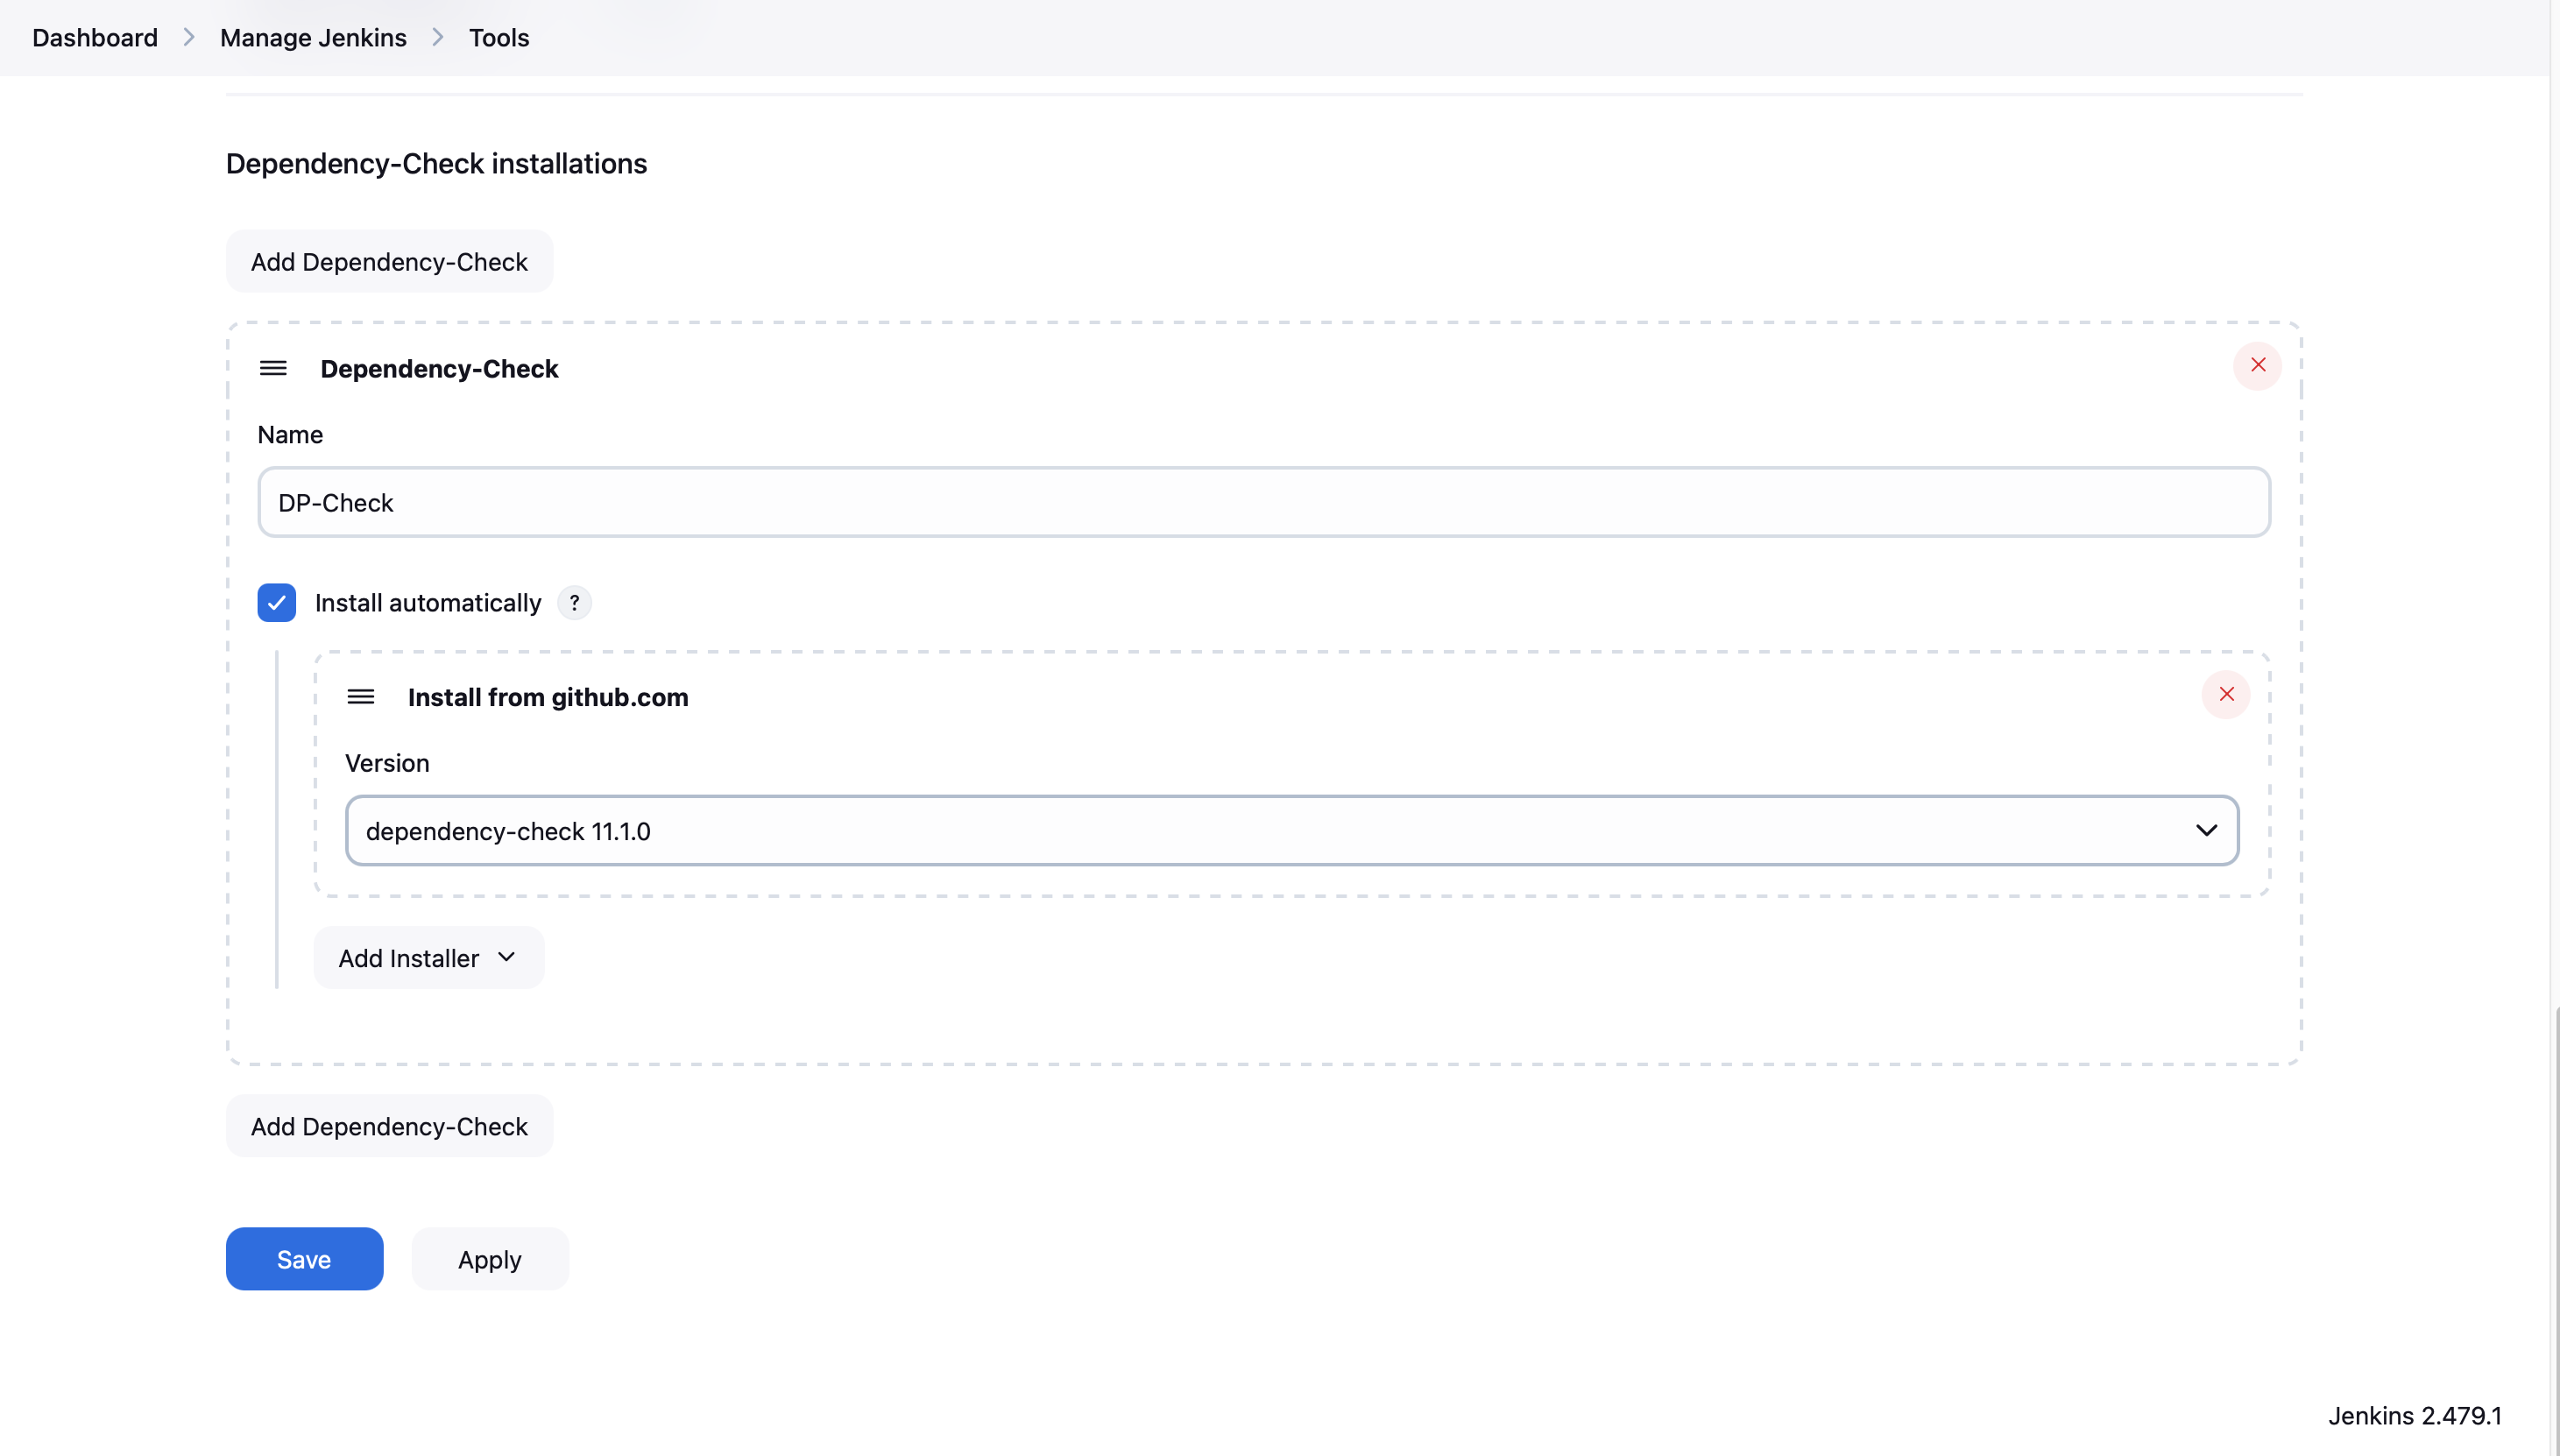
- Click "Save" at the bottom of the page
With these plugins installed and configured, your Jenkins setup is now ready to support a more comprehensive CI/CD pipeline for the Netflix Replica project.
Step 18: Docker Image Build and Push
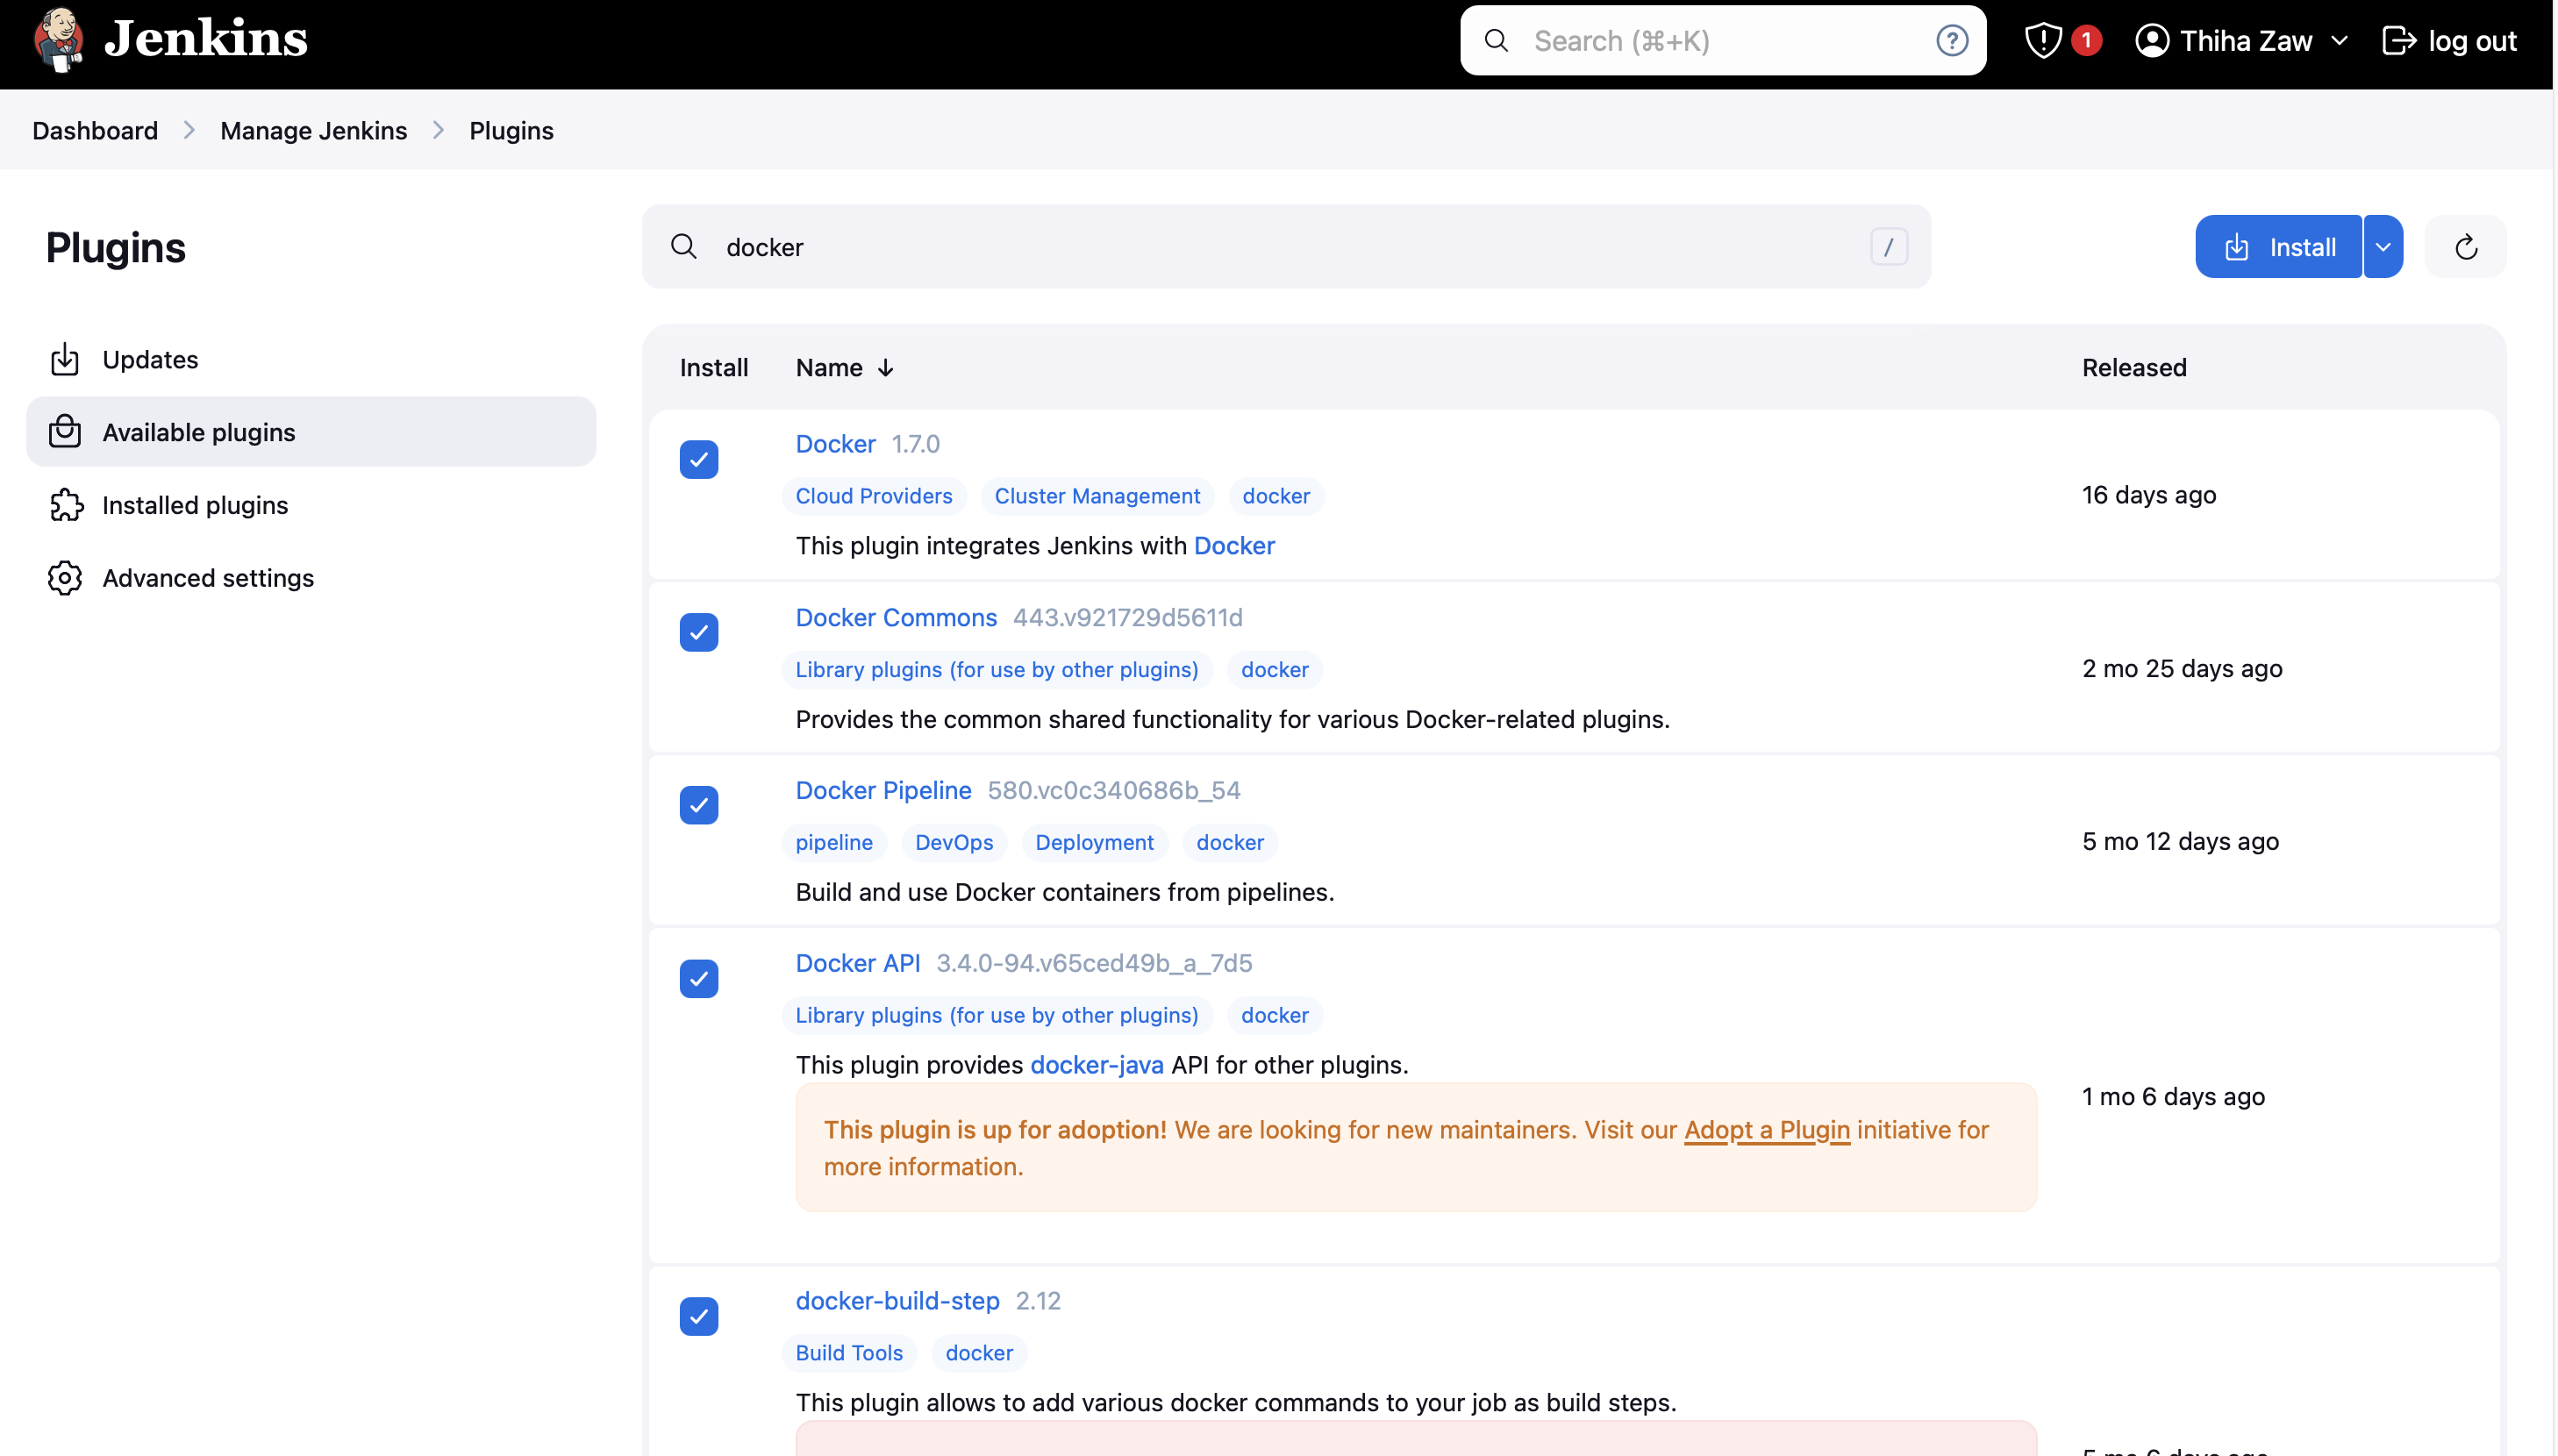
- We need to install the Docker tool in our system, Goto Dashboard → Manage Plugins → Available plugins → Search for Docker and install these plugins
Docker / Docker Commons / Docker Pipeline / Docker API / docker-build-step
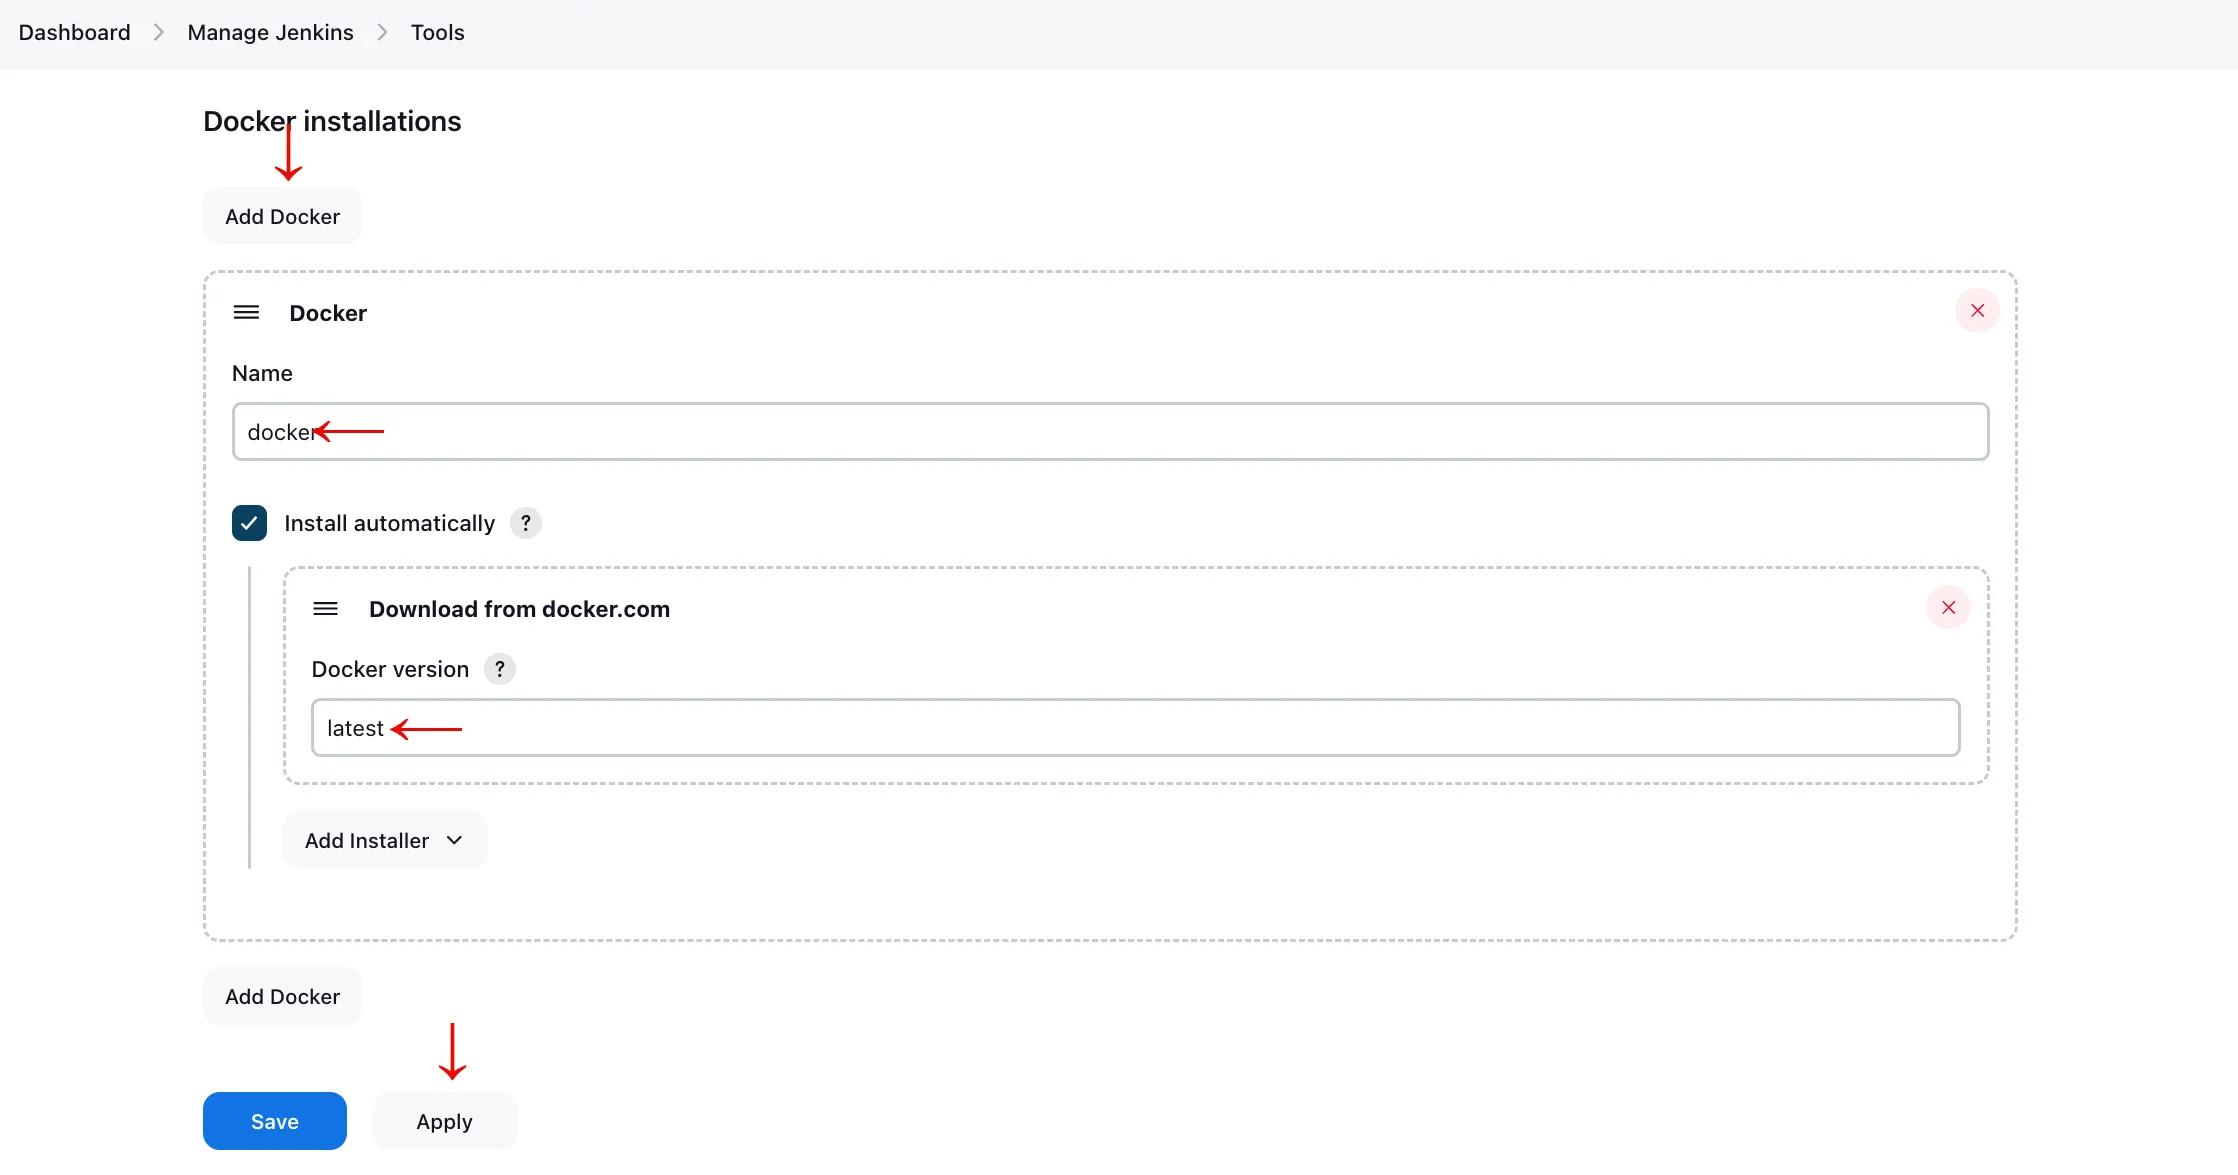
- With Docker plugins installed, navigate to Jenkins Tools to configure Docker. Put docker under Name and select latest under Docker version, click Apply and Save.
- Let's add the DockerHub credentials to Jenkins. Navigate to 'Manage Jenkins' > 'Manage Credentials' > 'Stores scoped to Jenkins' > 'Global'.
NOTE: You can store any credentials you want for you docker image storage.
- Enter your DockerHub username and password. For both the ID and Description fields, use a memorable name like "docker". Click "Create" when finished. (For me, I use the ECR. So, i will input my aws Credentials.
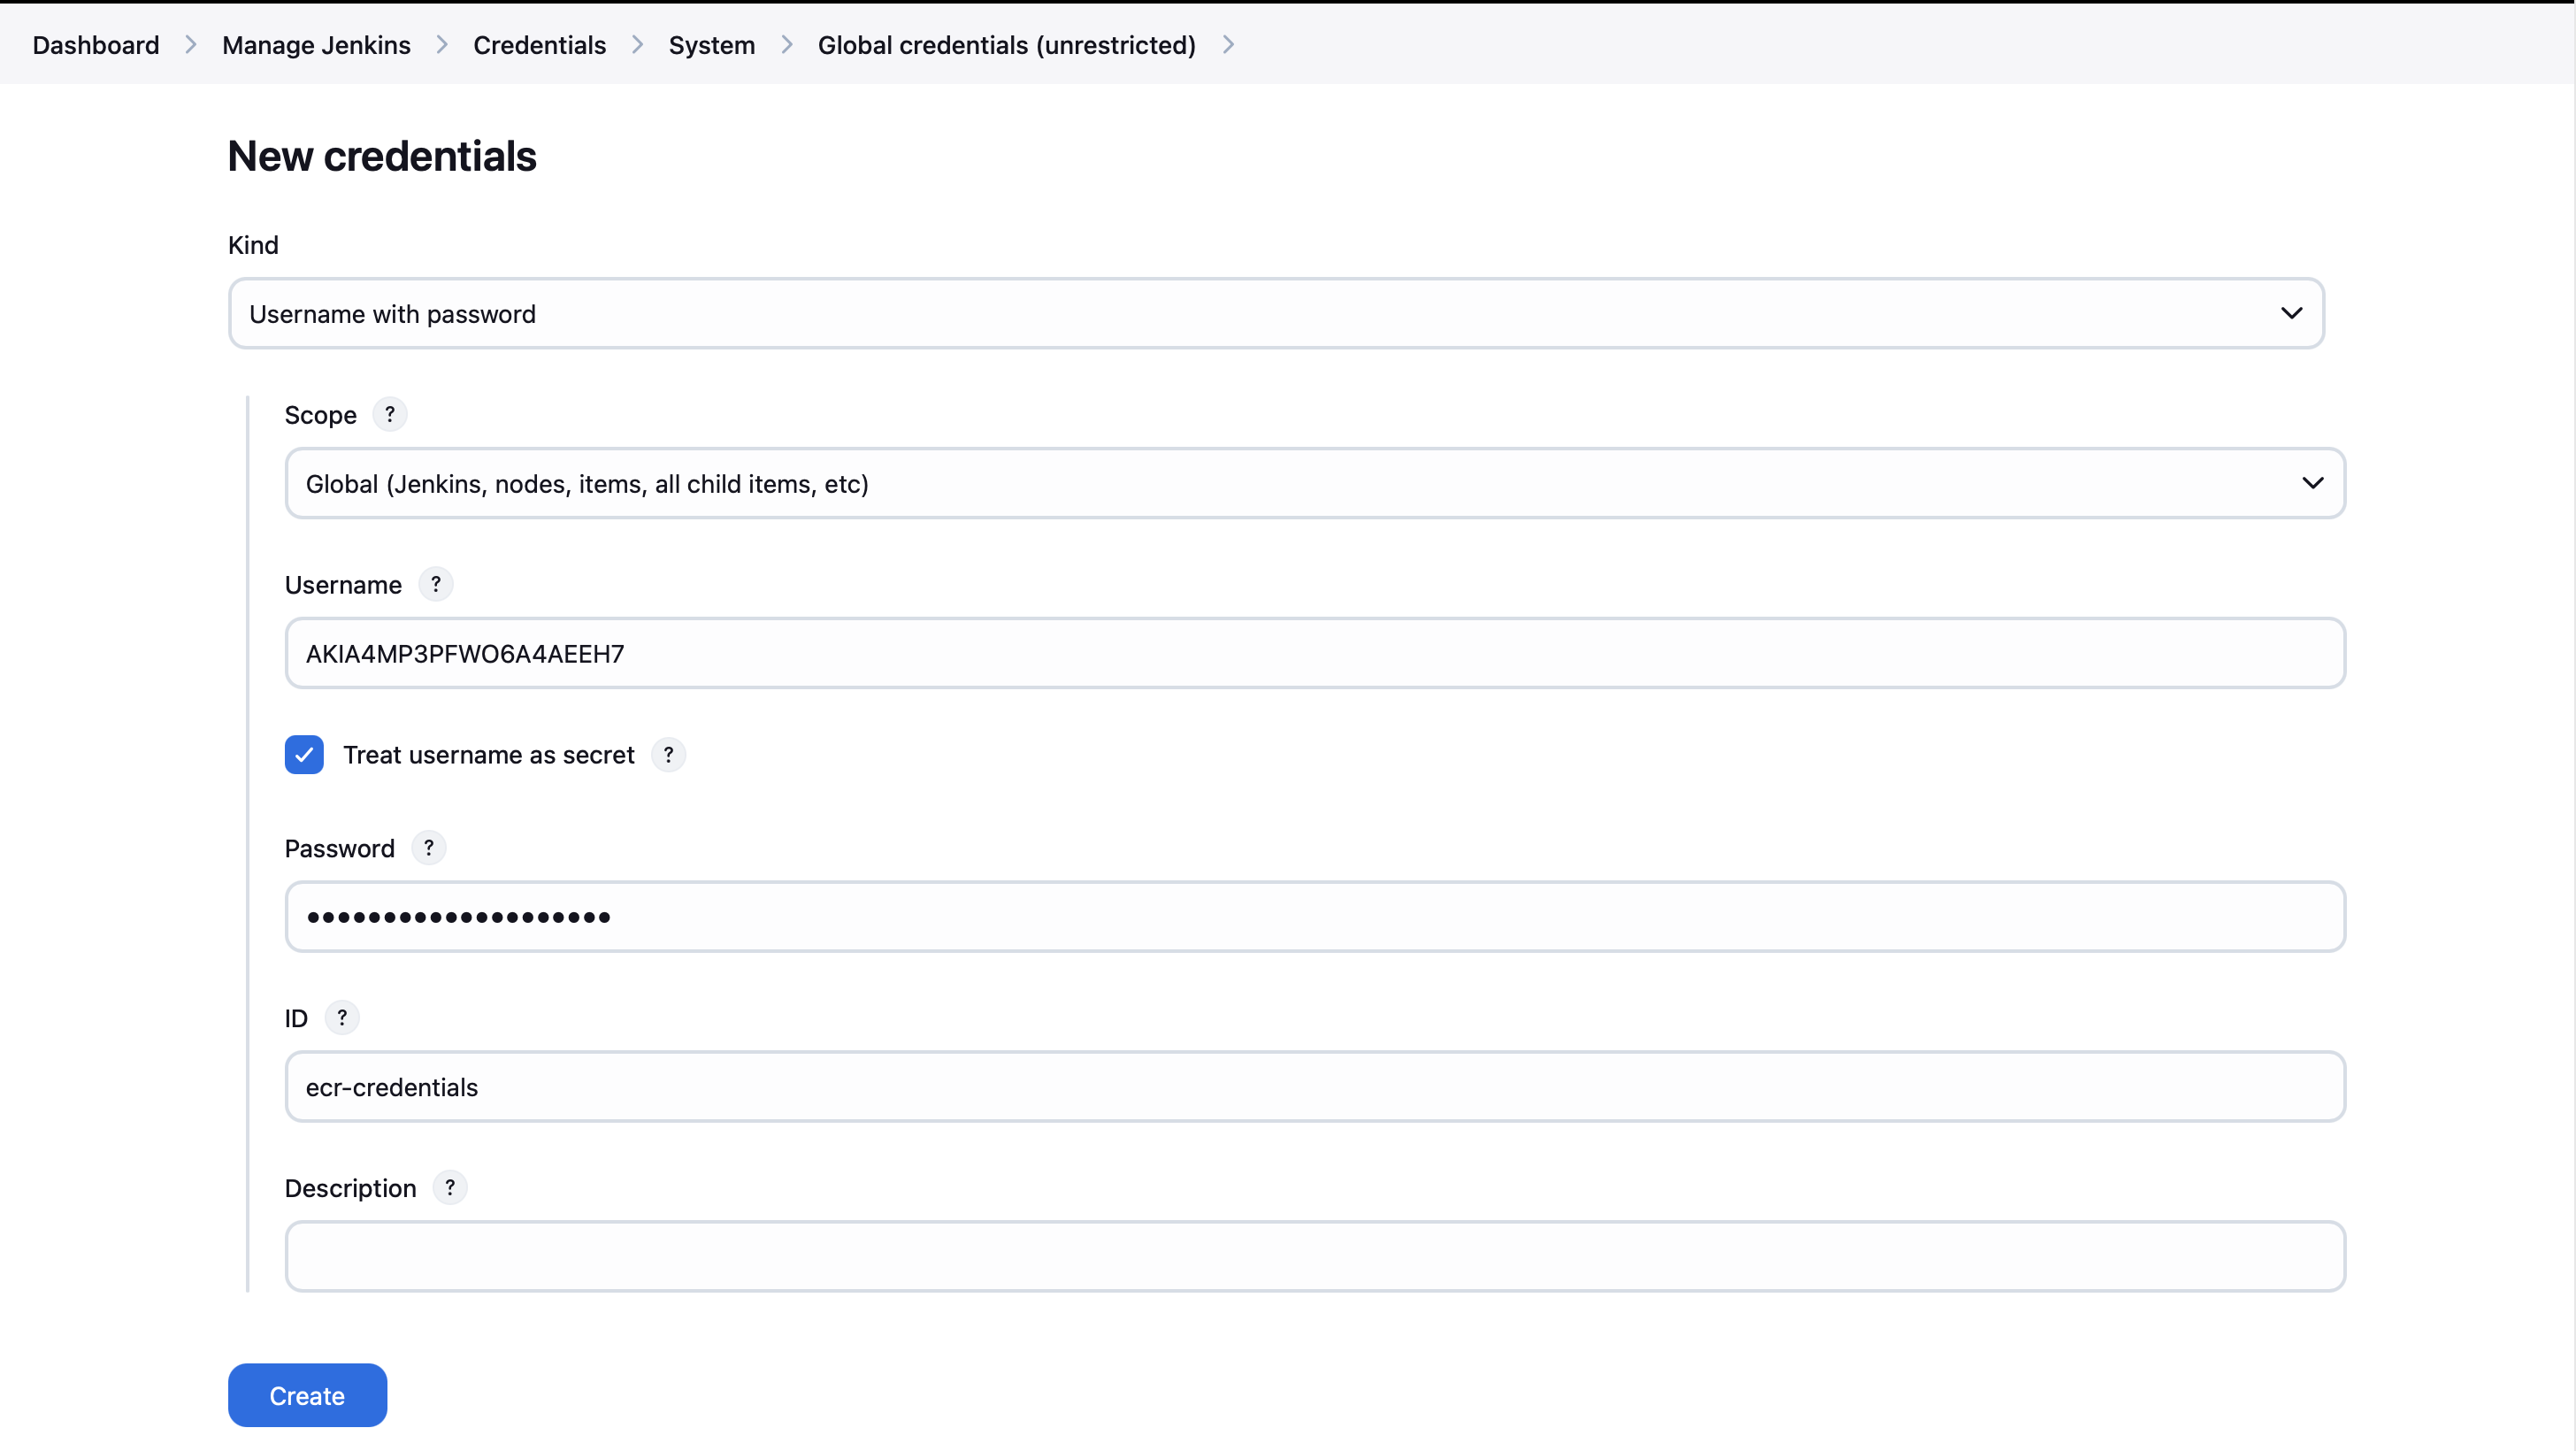
- You've now successfully added your DockerHub credentials to Jenkins' Global credentials (unrestricted).
- The pipeline shown below is building with Dockerhub.
Next, let's incorporate the following pipeline script into our Jenkins pipeline:
stage("Docker Build & Push"){
            steps{
                script{
                   withDockerRegistry(credentialsId: 'docker', toolName: 'docker'){
                       sh "docker build --build-arg TMDB_V3_API_KEY=yourAPItokenfromTMDB -t netflix ."
                       sh "docker tag netflix techrepos/netflix:latest "
                       sh "docker push techrepos/netflix:latest "
                    }
                }
            }
        }
        stage("TRIVY"){
            steps{
                sh "trivy image techrepos/netflix:latest > trivyimage.txt"
            }
        }
Step 19: Set Up Kubernetes Cluster
To create a Kubernetes cluster with master and worker nodes, you have two options:
Option 1: Use Terraform (Recommended)
If you're comfortable with Terraform, use the provided configuration in the "k8s_creation" folder:
- Go to the "k8s_creation" directory
- Execute
terraform init
- Adjust values in the Terraform files as needed
- Run
terraform applyto create your infrastructure.
- This method automates node_exporter configuration.

Option 2: Manual EC2 Setup
If you prefer manual setup, launch EC2 instances for master and worker nodes using this user data script:
#!/bin/bash
# Update the package index
sudo apt update -y
sudo apt install snapd
# Install essential tools
sudo apt install -y curl wget git
# Install Docker
sudo apt install -y docker.io
sudo usermod -aG docker $(whoami)
newgrp docker
sudo chmod 777 /var/run/docker.sock
# Enable and start Docker service
sudo systemctl enable docker
sudo systemctl start docker
# Set up Kubernetes repository
sudo apt install -y apt-transport-https ca-certificates gpg
curl -fsSL https://pkgs.k8s.io/core:/stable:/v1.30/deb/Release.key | sudo gpg --dearmor -o /etc/apt/keyrings/kubernetes-apt-keyring.gpg
echo 'deb [signed-by=/etc/apt/keyrings/kubernetes-apt-keyring.gpg] https://pkgs.k8s.io/core:/stable:/v1.30/deb/ /' | sudo tee /etc/apt/sources.list.d/kubernetes.list
# Install Kubernetes components
sudo apt update -y
sudo apt install -y kubelet kubeadm kubectl
sudo apt-mark hold kubelet kubeadm kubectl
sudo systemctl enable --now kubelet
#Install and Configure Node Exporter
sudo useradd --system --no-create-home --shell /bin/false node_exporter
#Download and install Node Exporter
wget https://github.com/prometheus/node_exporter/releases/download/v1.8.2/node_exporter-1.8.2.linux-amd64.tar.gz
tar xvf node_exporter-1.8.2.linux-amd64.tar.gz
sudo mv node_exporter-1.8.2.linux-amd64/node_exporter /usr/local/bin/
rm -rf node_exporter*
#Create a Node Exporter service file
cat <<EOL | sudo tee /etc/systemd/system/node_exporter.service
[Unit]
Description=Node Exporter
Wants=network-online.target
After=network-online.target

[Service]
User=node_exporter
Group=node_exporter
Type=simple
ExecStart=/usr/local/bin/node_exporter --web.listen-address=:9101

[Install]
WantedBy=multi-user.target
EOL
#Start and enable Node Exporter service
sudo systemctl daemon-reload
sudo systemctl start node_exporter
sudo systemctl enable node_exporter
To create the master and worker nodes:
- Launch an EC2 instance for the master node:
- Use an Ubuntu AMI
- Choose an instance type (e.g., t2.medium or larger)
- In the "User data" section under "Advanced details", paste the script above
- Make sure to include "Master" in the instance name
- Launch EC2 instance(s) for worker node(s):
- Use the same process as the master node
- Ensure the worker nodes are in the same VPC and security group as the master
- Do not include "Master" in the worker node names
Step 20: After the master node is initialized, SSH into it and run:
As we use low CPU and MEMORY, i use this flag --ignore-preflight-errors=all. Depends on the instance type you choose, you can select the preferred one.
You can SKIP this steps if you use the terraform. terraform already applied for this.
sudo hostnamectl set-hostname K8s-Master
sudo kubeadm init --ignore-preflight-errors=all
sleep 60
mkdir -p $HOME/.kube
sudo cp -i /etc/kubernetes/admin.conf $HOME/.kube/config
sudo chown $(id -u):$(id -g) $HOME/.kube/config
kubectl apply -f https://raw.githubusercontent.com/projectcalico/calico/v3.28.2/manifests/calico.yaml
After terraform creation, you can print out the join command copy it from the Master Node.
kubeadm token create --print-join-commandNote: In some cases, you may need to restart the Master Node for the nodes to become fully operational. Ensure no processes are running in the background. Wait at least 5 minutes before restarting. The exact time may vary depending on your VM specifications and network speed.
Step 21: Worker Node Configuration and Get Config file for CD
With these steps, you'll have a functional Kubernetes cluster with a master node and worker node(s) ready for deploying your Netflix Replica application.
With the 'kubeadm join' command administered, follow these steps to obtain the Kubernetes configuration file:
sudo hostnamectl set-hostname K8s-Worker # (K8s-Worker-01) If you have 2 workers, please set the name behind.
#Copy the token from master node and apply
kubeadm join 10.0.1.91:6443 — token w4j7yg.9mr663kzo0rb4efh \
— discovery-token-ca-cert-hash sha256:69b3cda3cb9d019ef71457f05054aee74eeacce58e36ea39622e88f014ca8db0 --ignore-preflight-errors=all- On the master node, change to the '/.kube' directory:
cd .kube
- Open and view the contents of the config file:
cat config
- Copy the entire contents of the config file
- Create a new file named 'secret-file.txt' on your local machine and paste the copied content into it.
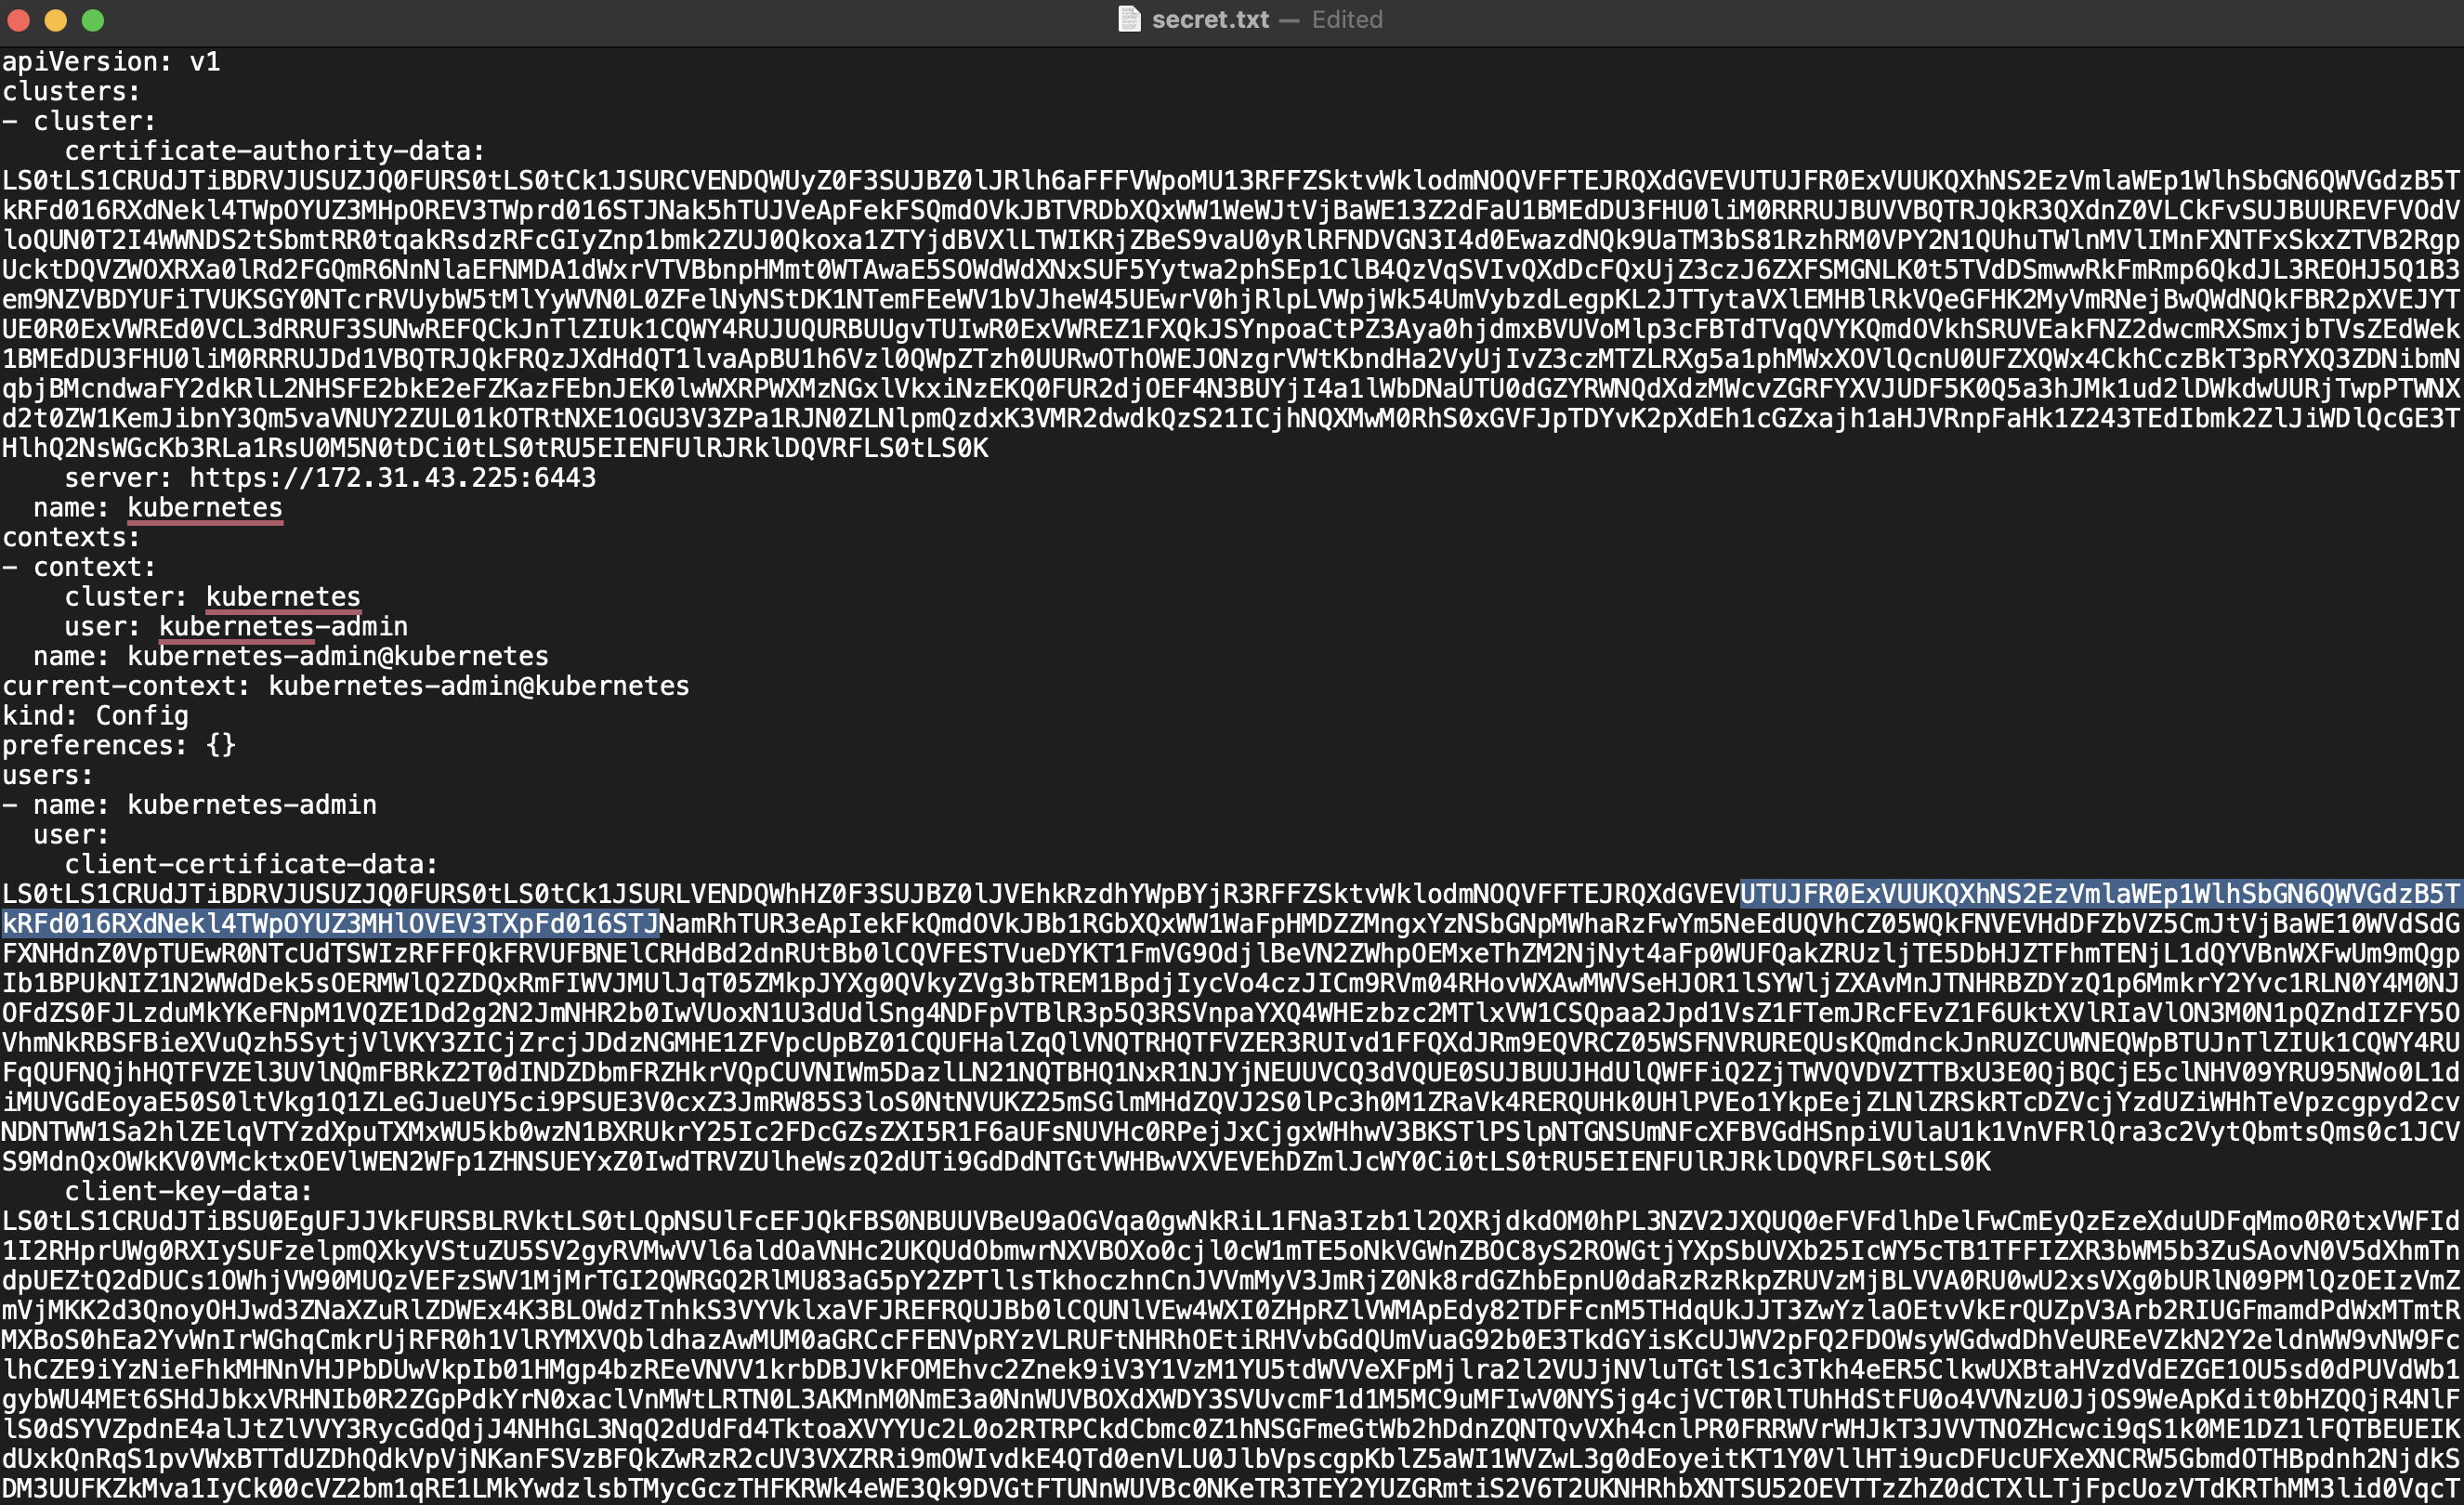
- Store this 'secret-file.txt' in a secure location, as it will be used to set up Kubernetes credentials in Jenkins
This configuration file contains sensitive information that allows access to your Kubernetes cluster, so ensure it's kept secure and not shared publicly.
Step 22: Installing Kubernetes Plugins and Configuring Credentials
Let's install four essential Kubernetes plugins on Jenkins:
Kubernetes Client API, Kubernetes Credentials, Kubernetes, and Kubernetes CLI
After installation, we'll configure the Kubernetes credentials in Jenkins:
- Click "Add Credentials" in the Jenkins dashboard
- Select "Global Credentials"
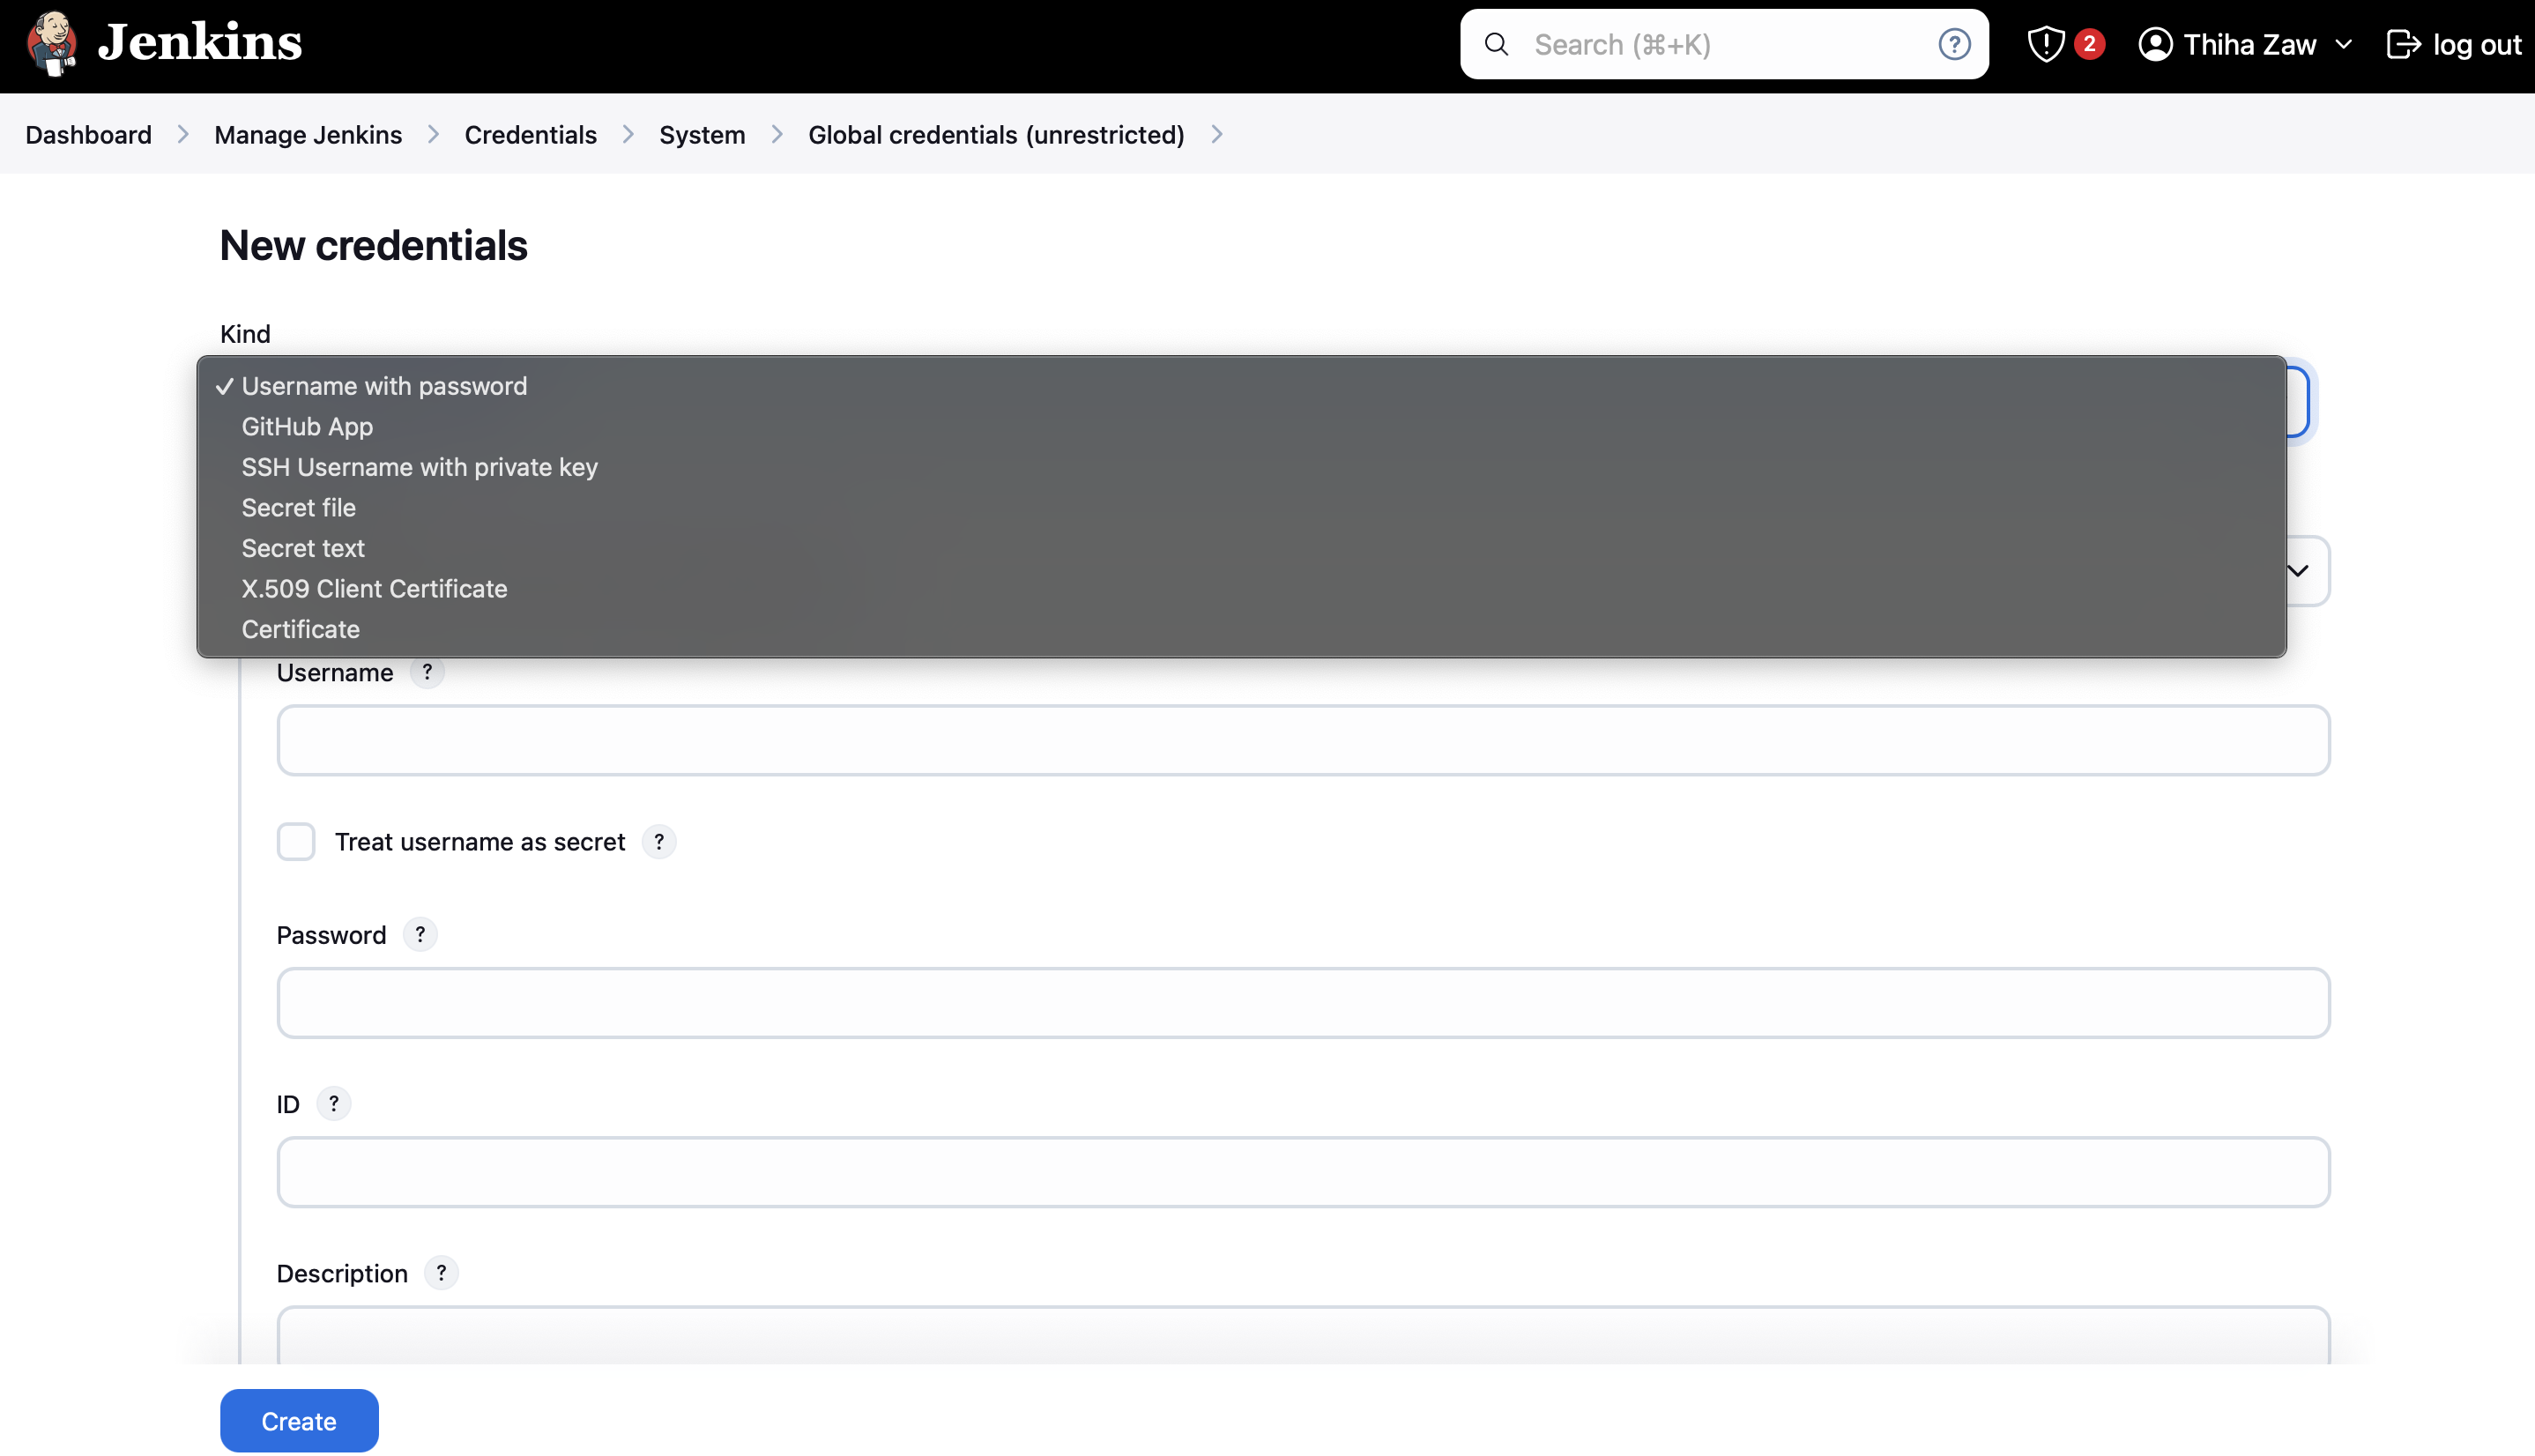
- Under "File," choose the 'secret-file.txt' you created earlier
- Set both the ID and Description to a memorable name (e.g., "k8s")
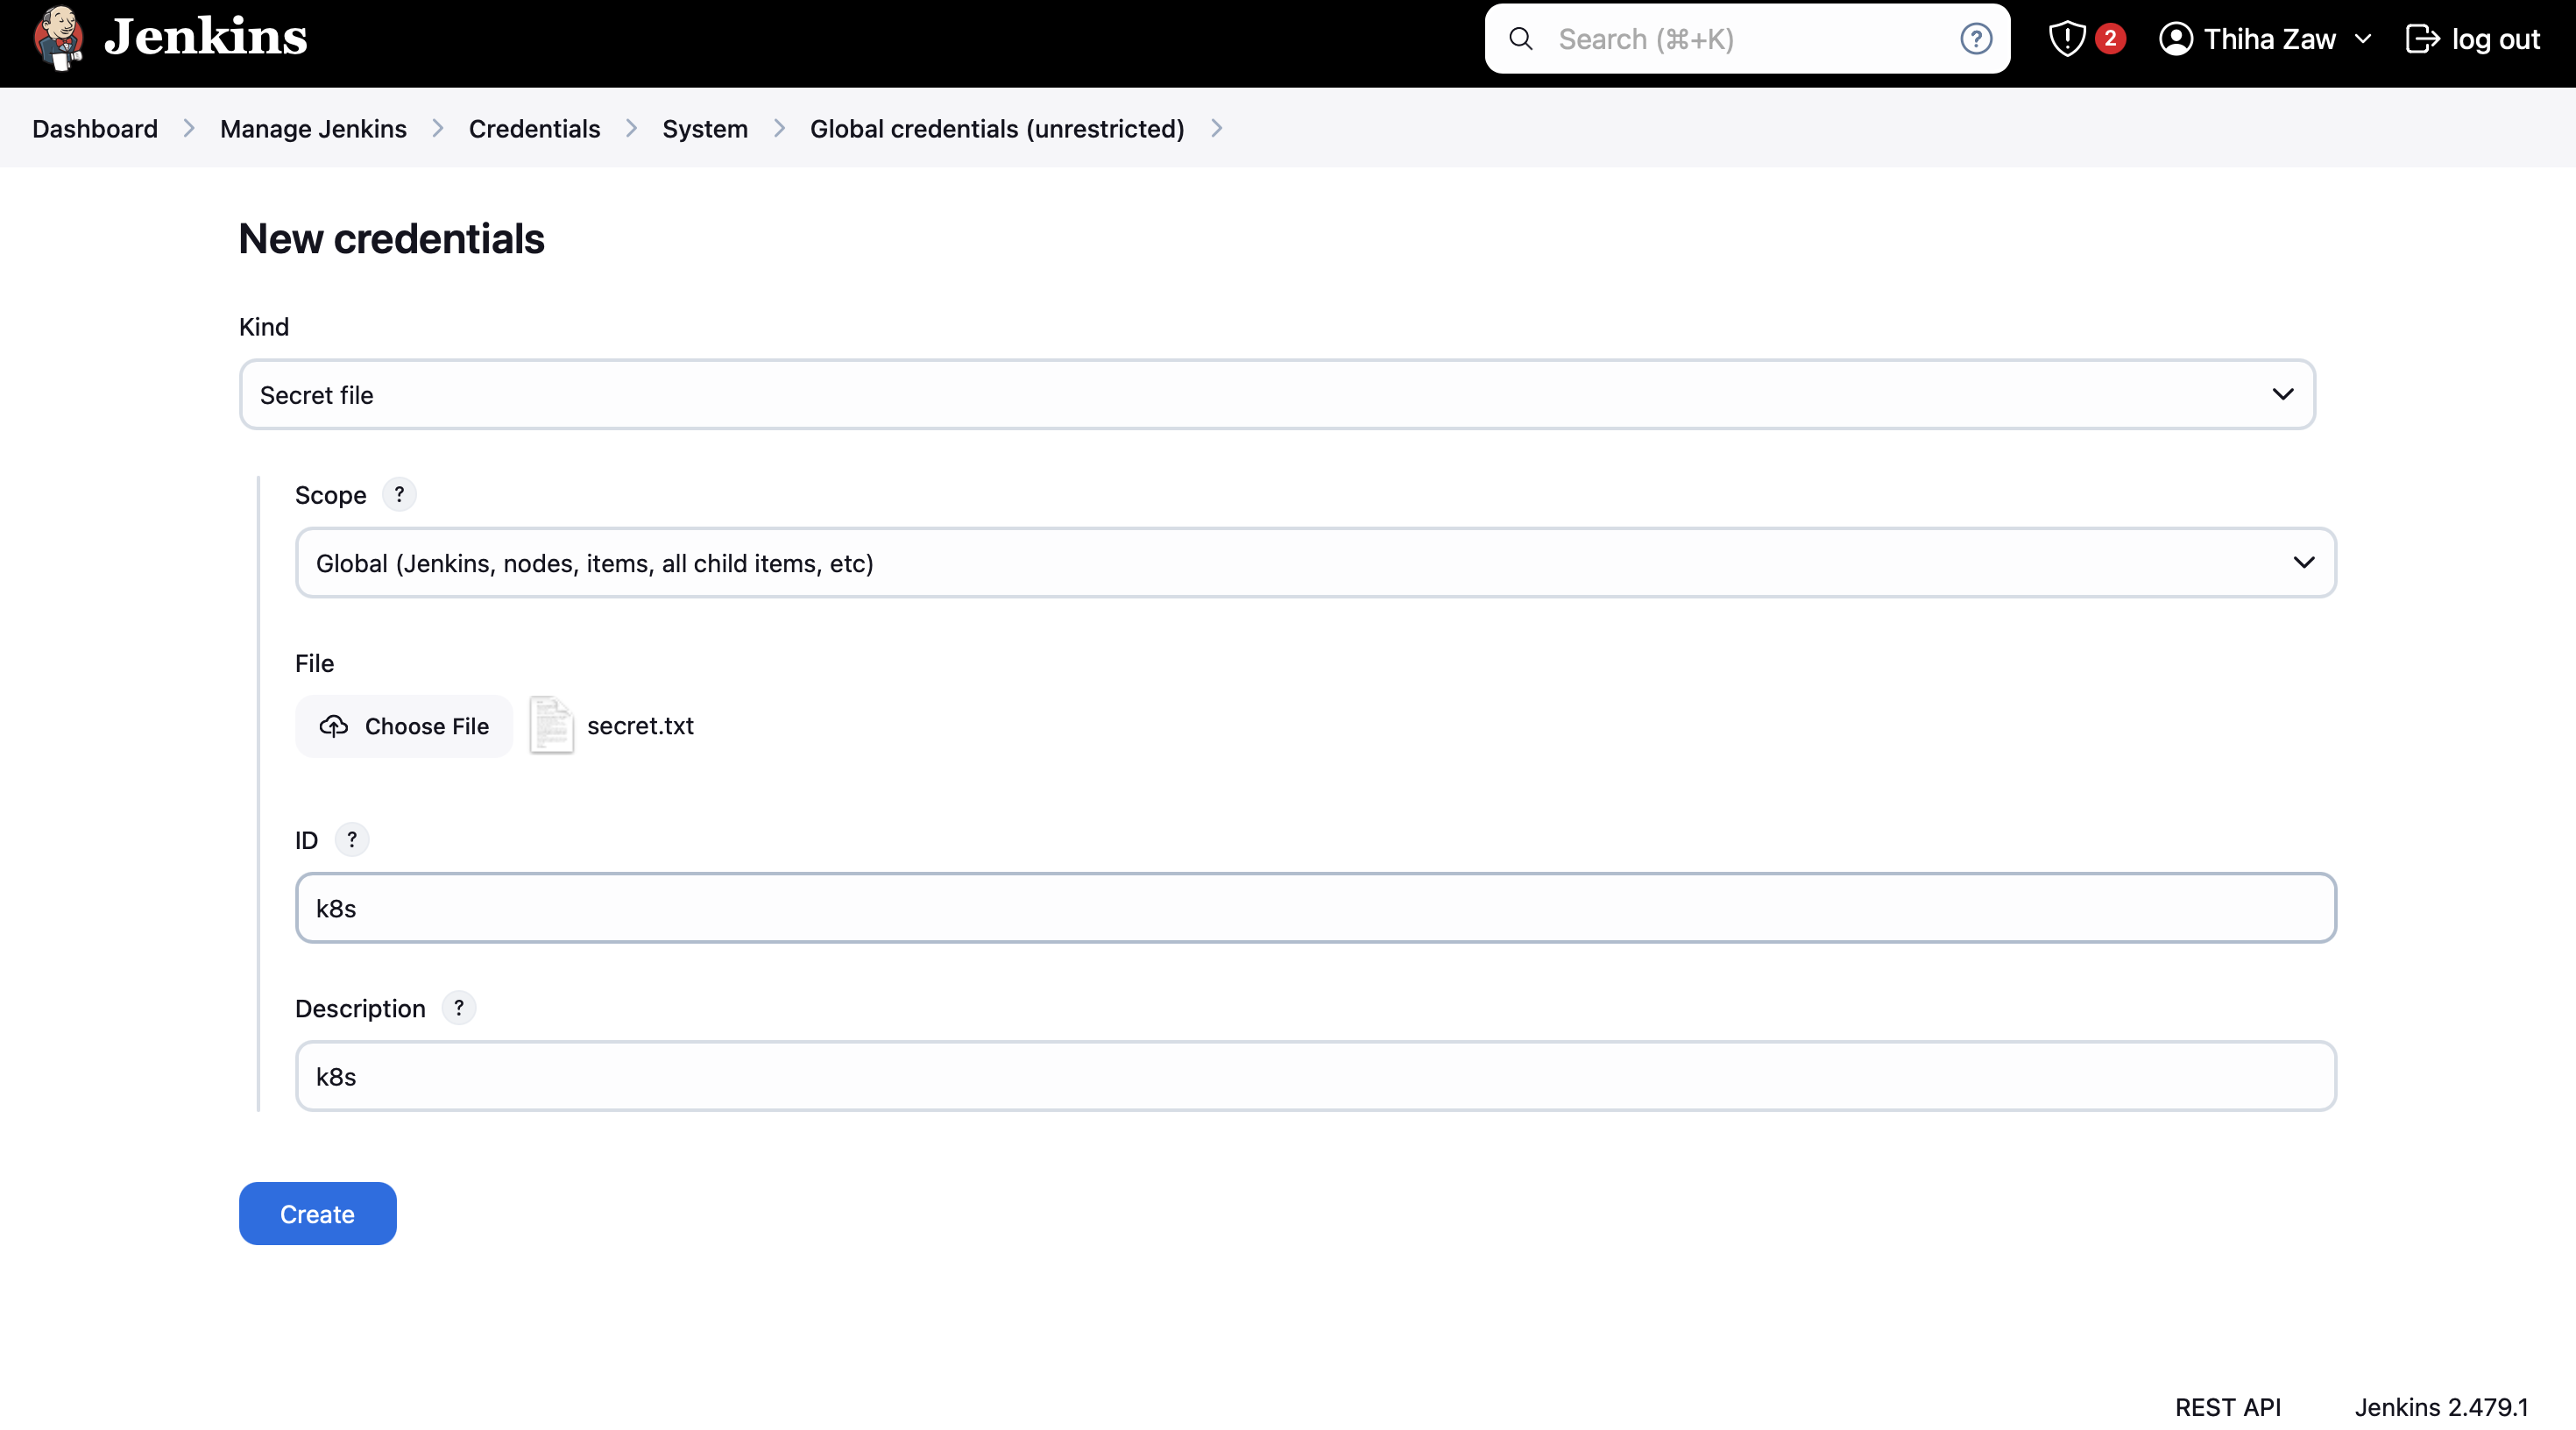
- Click "Create" to save the new credential
With these steps completed, your Kubernetes credential is now set up in Jenkins.
Step 23: Install Node_exporter on Master and Worker Nodes (Skip if use terraform)
Step 23: Install Node_exporter on Master and Worker Nodes (Skip if use terraform)
To monitor the performance of our Kubernetes nodes, we'll install Node_exporter on both the master and worker nodes. Follow these steps:
- SSH into each node (master and workers)
- Download Node_exporter:
wget https://github.com/prometheus/node_exporter/releases/download/v1.6.1/node_exporter-1.6.1.linux-amd64.tar.gz
- Extract the downloaded file:
tar xvfz node_exporter-1.6.1.linux-amd64.tar.gz
- Move the node_exporter binary to /usr/local/bin:
sudo mv node_exporter-1.6.1.linux-amd64/node_exporter /usr/local/bin/
- Create a Node_exporter service file:
sudo vim /etc/systemd/system/node_exporter.service
- Add the following content to the service file:
[Unit]
Description=Node Exporter
After=network.target

[Service]
User=node_exporter
Group=node_exporter
Type=simple
ExecStart=/usr/local/bin/node_exporter

[Install]
WantedBy=multi-user.target
- Create a user for Node_exporter:
sudo useradd -rs /bin/false node_exporter
- Start and enable the Node_exporter service:
sudo systemctl daemon-reload
sudo systemctl start node_exporter
sudo systemctl enable node_exporter
- Verify that Node_exporter is running:
sudo systemctl status node_exporter
Repeat these steps on all master and worker nodes. Node_exporter will now be collecting metrics that can be scraped by Prometheus for monitoring your Kubernetes cluster.
Step 24: Configure Prometheus to Scrape Node_exporter Metrics
Now that Node_exporter is installed on all nodes, we need to configure Prometheus to scrape these metrics. Follow these steps:
- SSH into the node where Prometheus is installed
- Edit the Prometheus configuration file:
sudo vim /etc/prometheus/prometheus.yml
- Add the following job to the
scrape_configssection:- job_name: 'node_exporter' static_configs: - targets: ['master-node-ip:9101', 'worker-node-ip:9101']
Replace master-node-ip, worker-node-1-ip, and worker-node-2-ip with the actual IP addresses of your Kubernetes nodes.
- Save the file and exit the editor
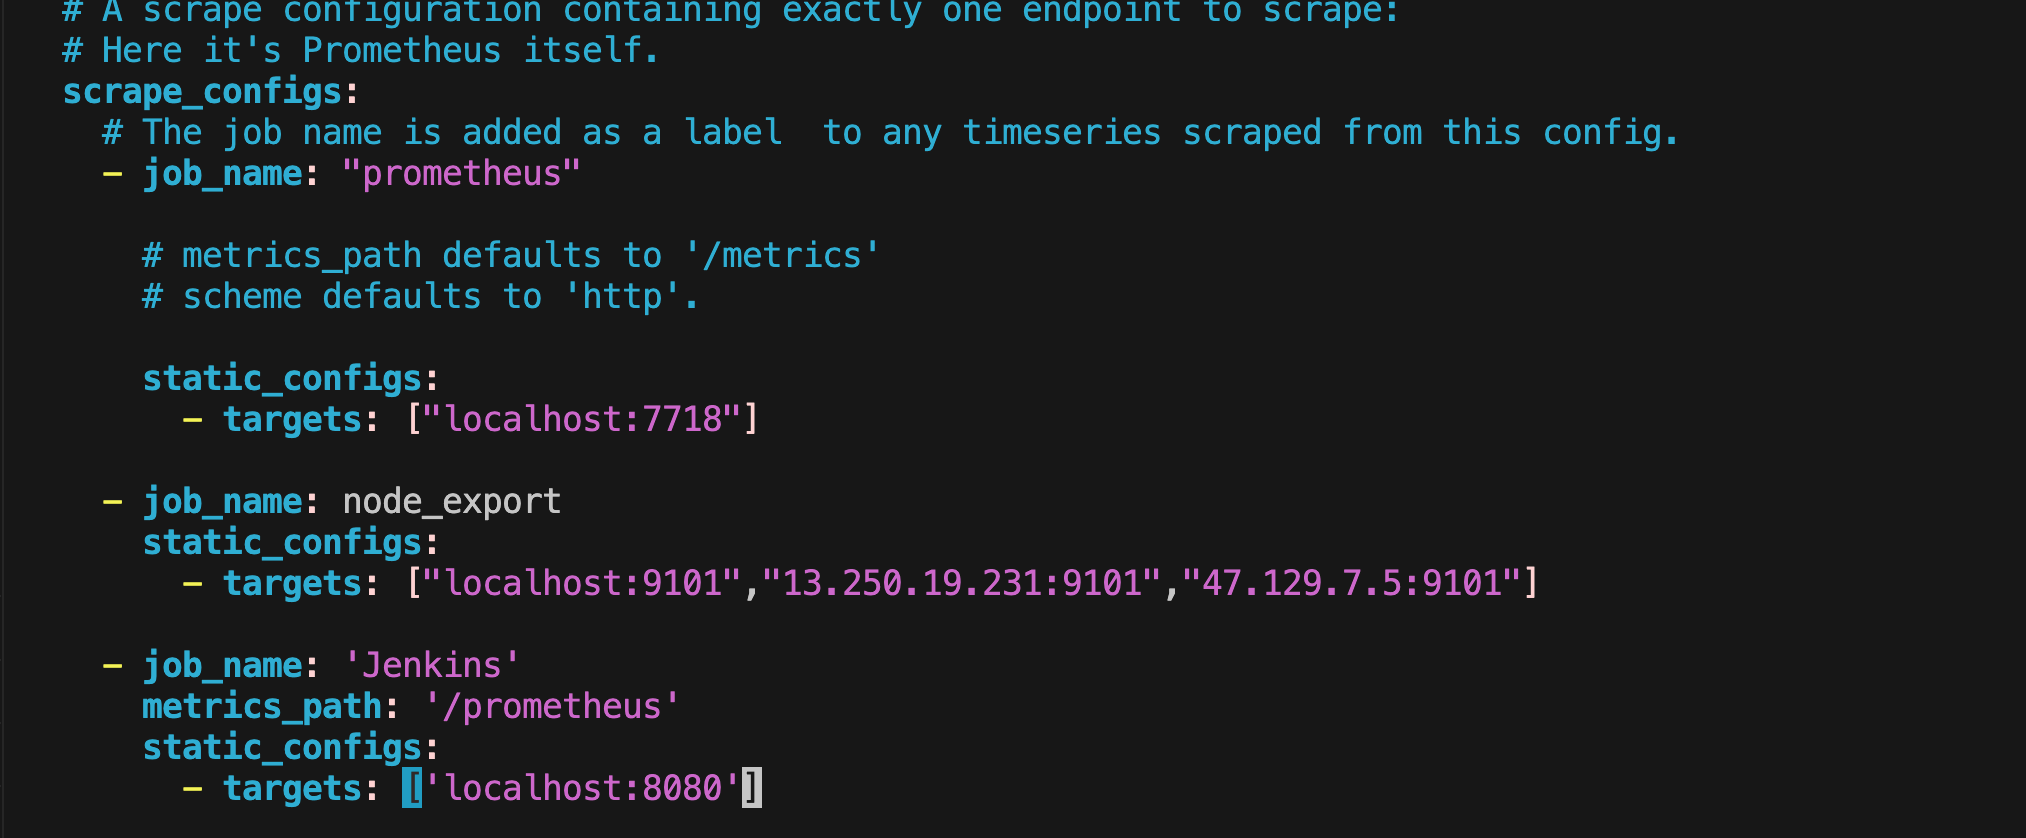
- Restart Prometheus to apply the changes:
sudo systemctl restart prometheus
- Verify that Prometheus is scraping the new targets:
- Open the Prometheus web interface (usually at http://prometheus-ip:9090)
- Note: We use port 7718 for prometheus only and installed prometheus only on the CICD and Monitoring Server.
- Go to Status > Targets to see if the new node_exporter targets are up
- Open the Prometheus web interface (usually at http://prometheus-ip:9090)
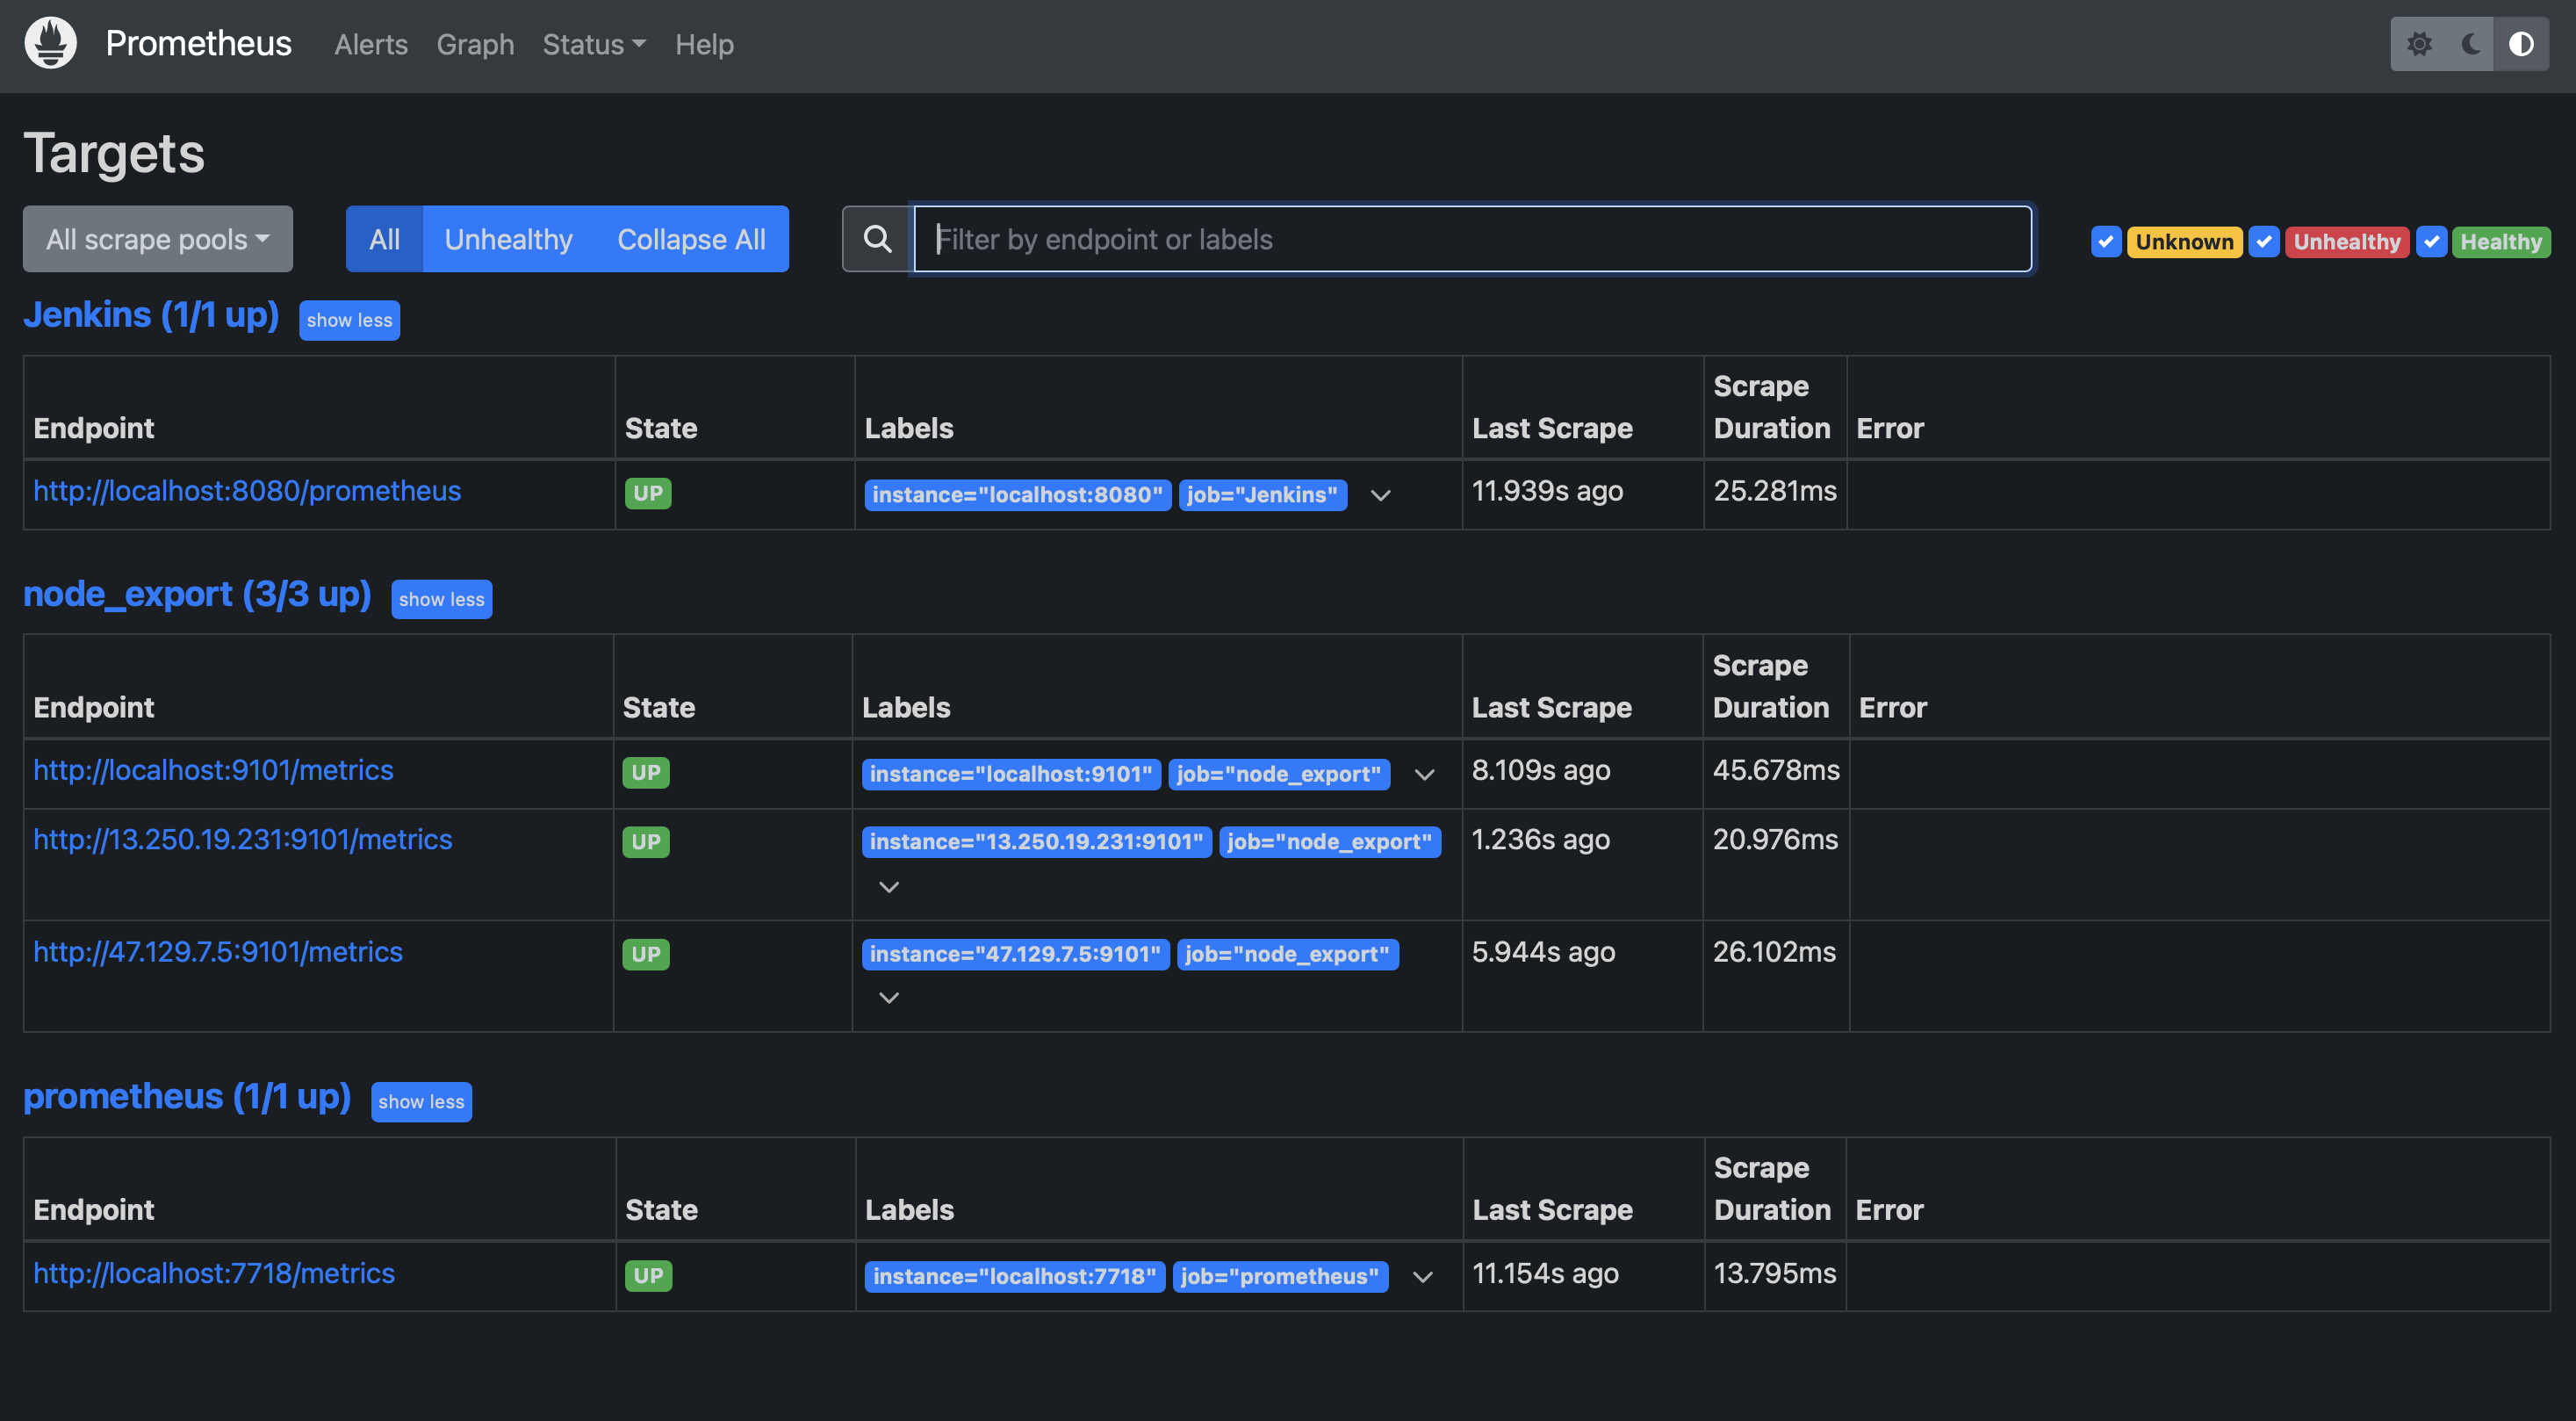
With these steps completed, Prometheus will now collect metrics from all your Kubernetes nodes, allowing you to monitor the health and performance of your cluster effectively.
Step 25: To set up the pipeline for Jenkins, follow these steps:
- Log in to your Jenkins dashboard
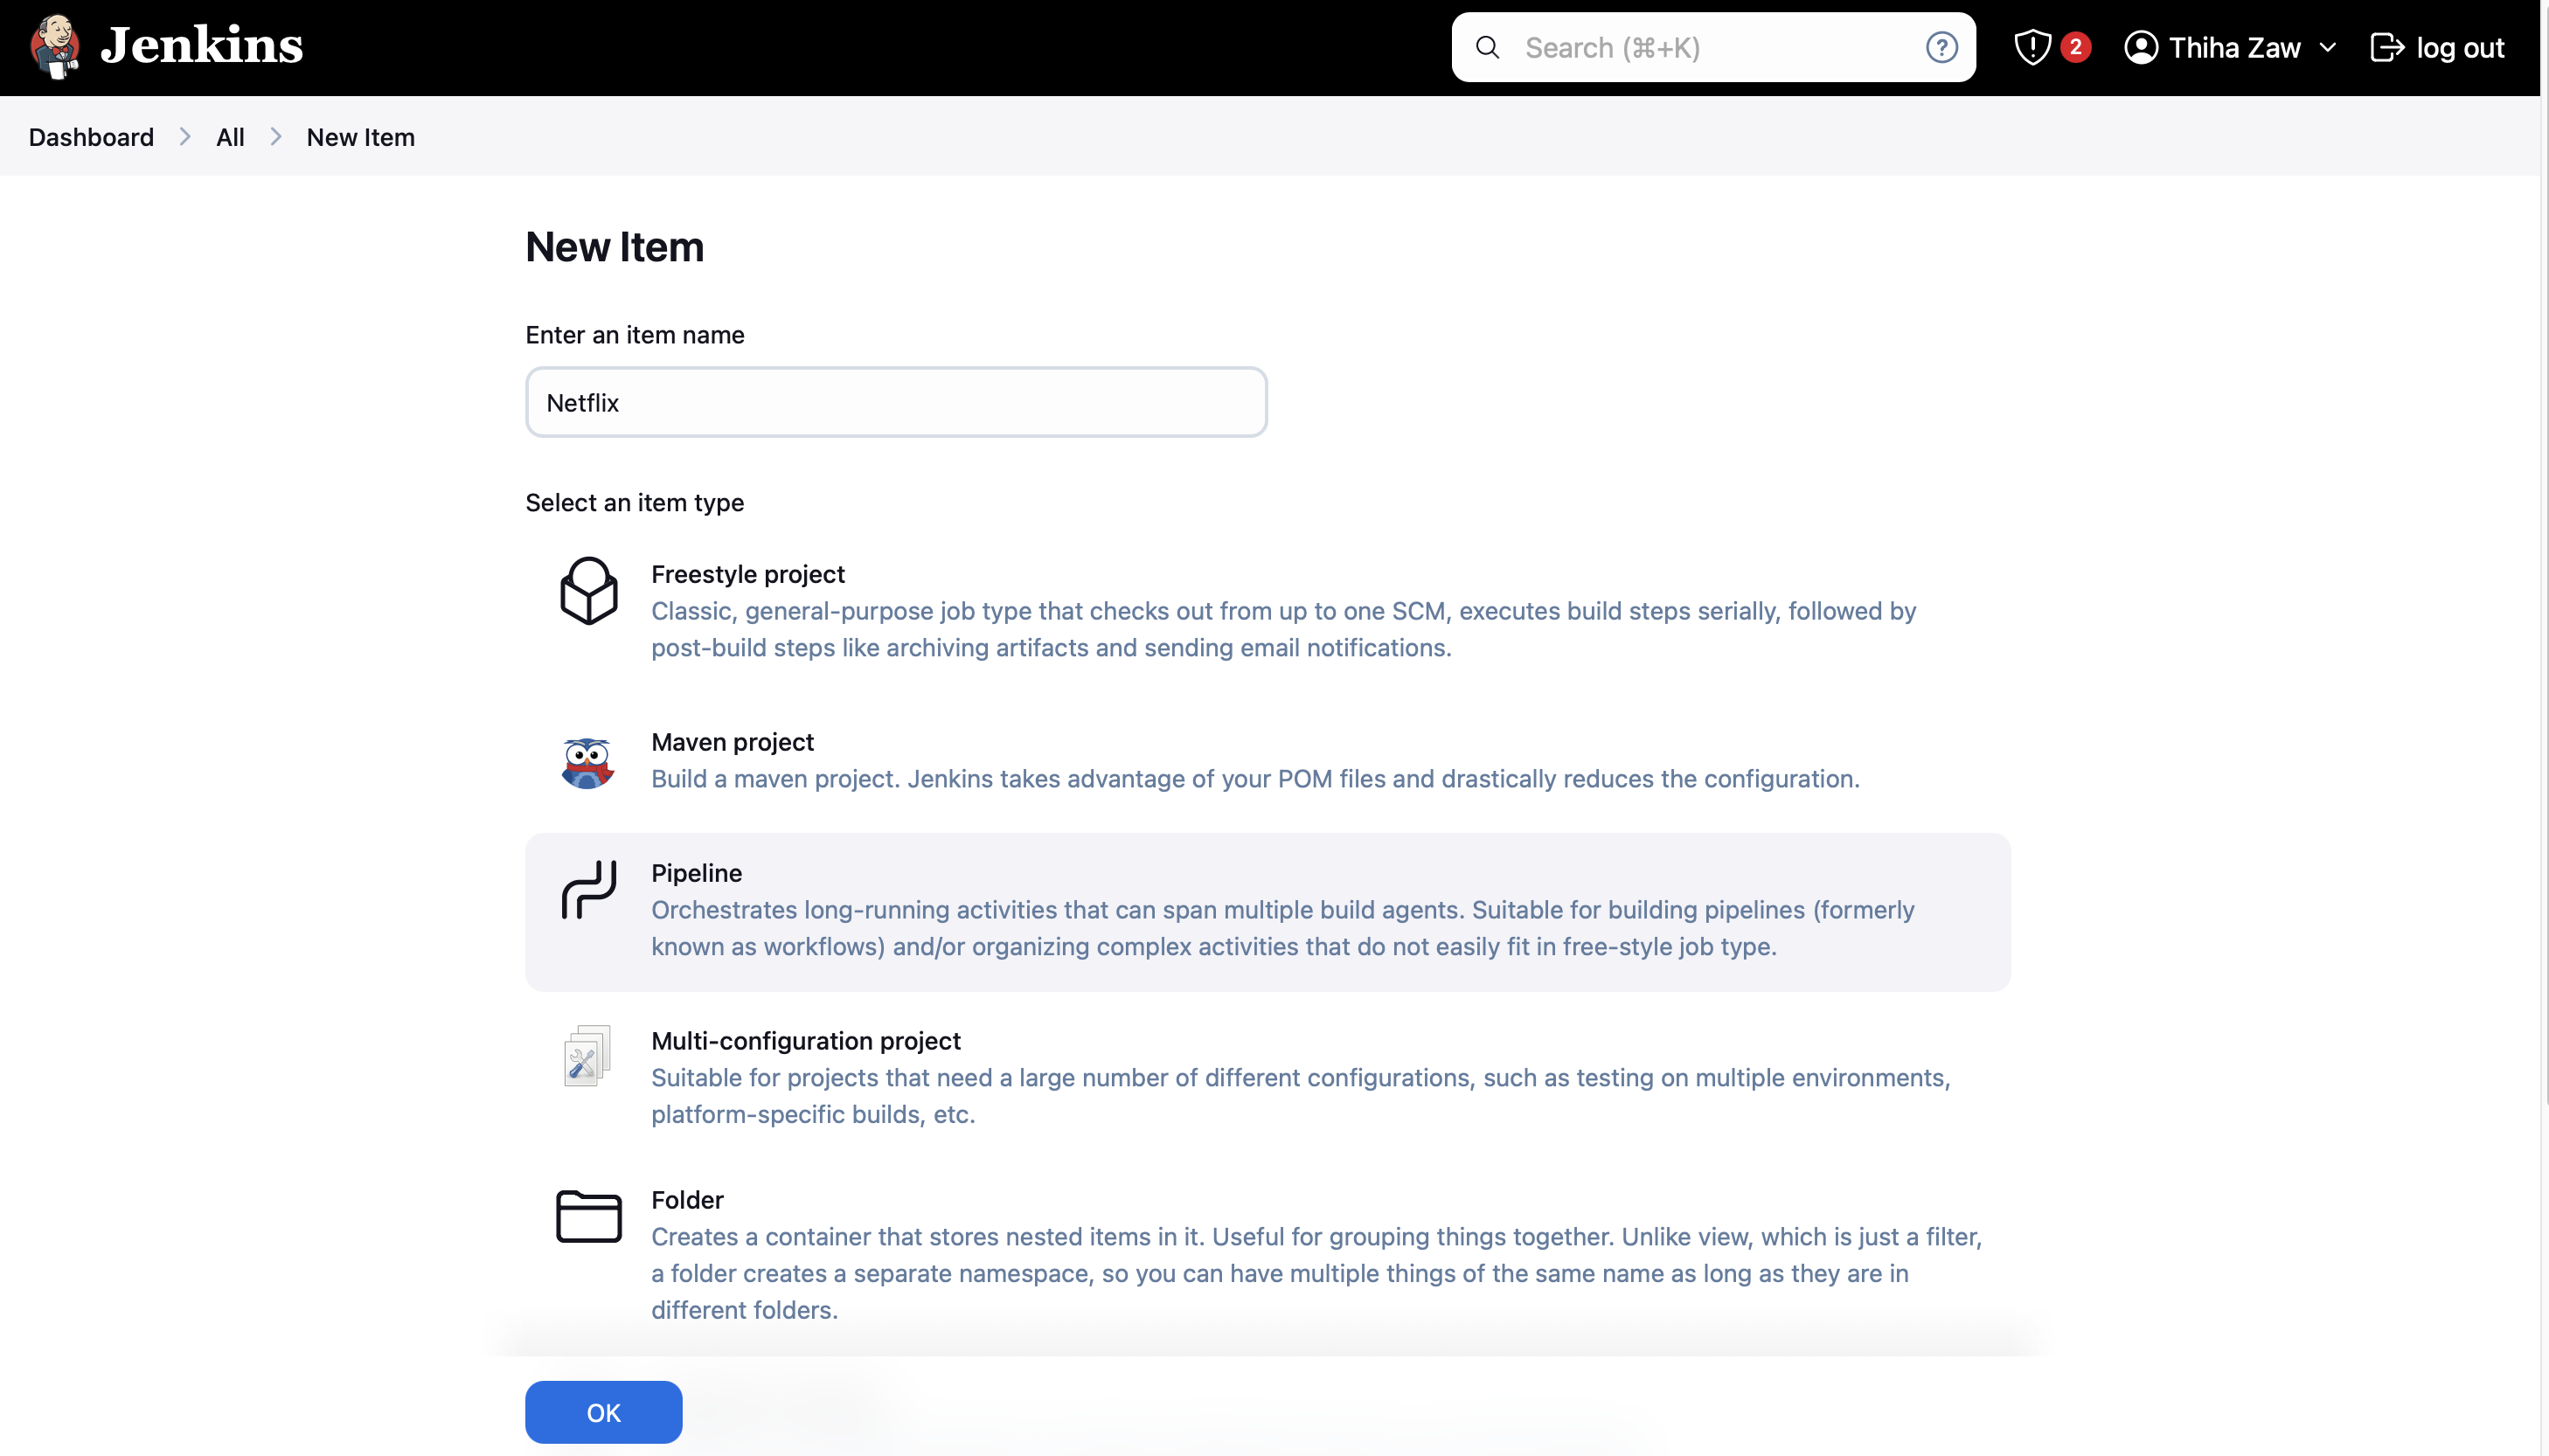
- Click on "New Item" to create a new pipeline job
- Enter a name for your pipeline (e.g., "Netflix-Replica-Pipeline") and select "Pipeline" as the job type
- Click "OK" to create the job
- In the job configuration page, scroll down to the "Pipeline" section
- Select "Pipeline script" from the "Definition" dropdown
- Copy and paste the complete pipeline script provided into the script text area
- Adjust any environment-specific variables or credentials as needed
- Click "Save" to save your pipeline configuration
- Click "Build Now" to run your pipeline for the first time
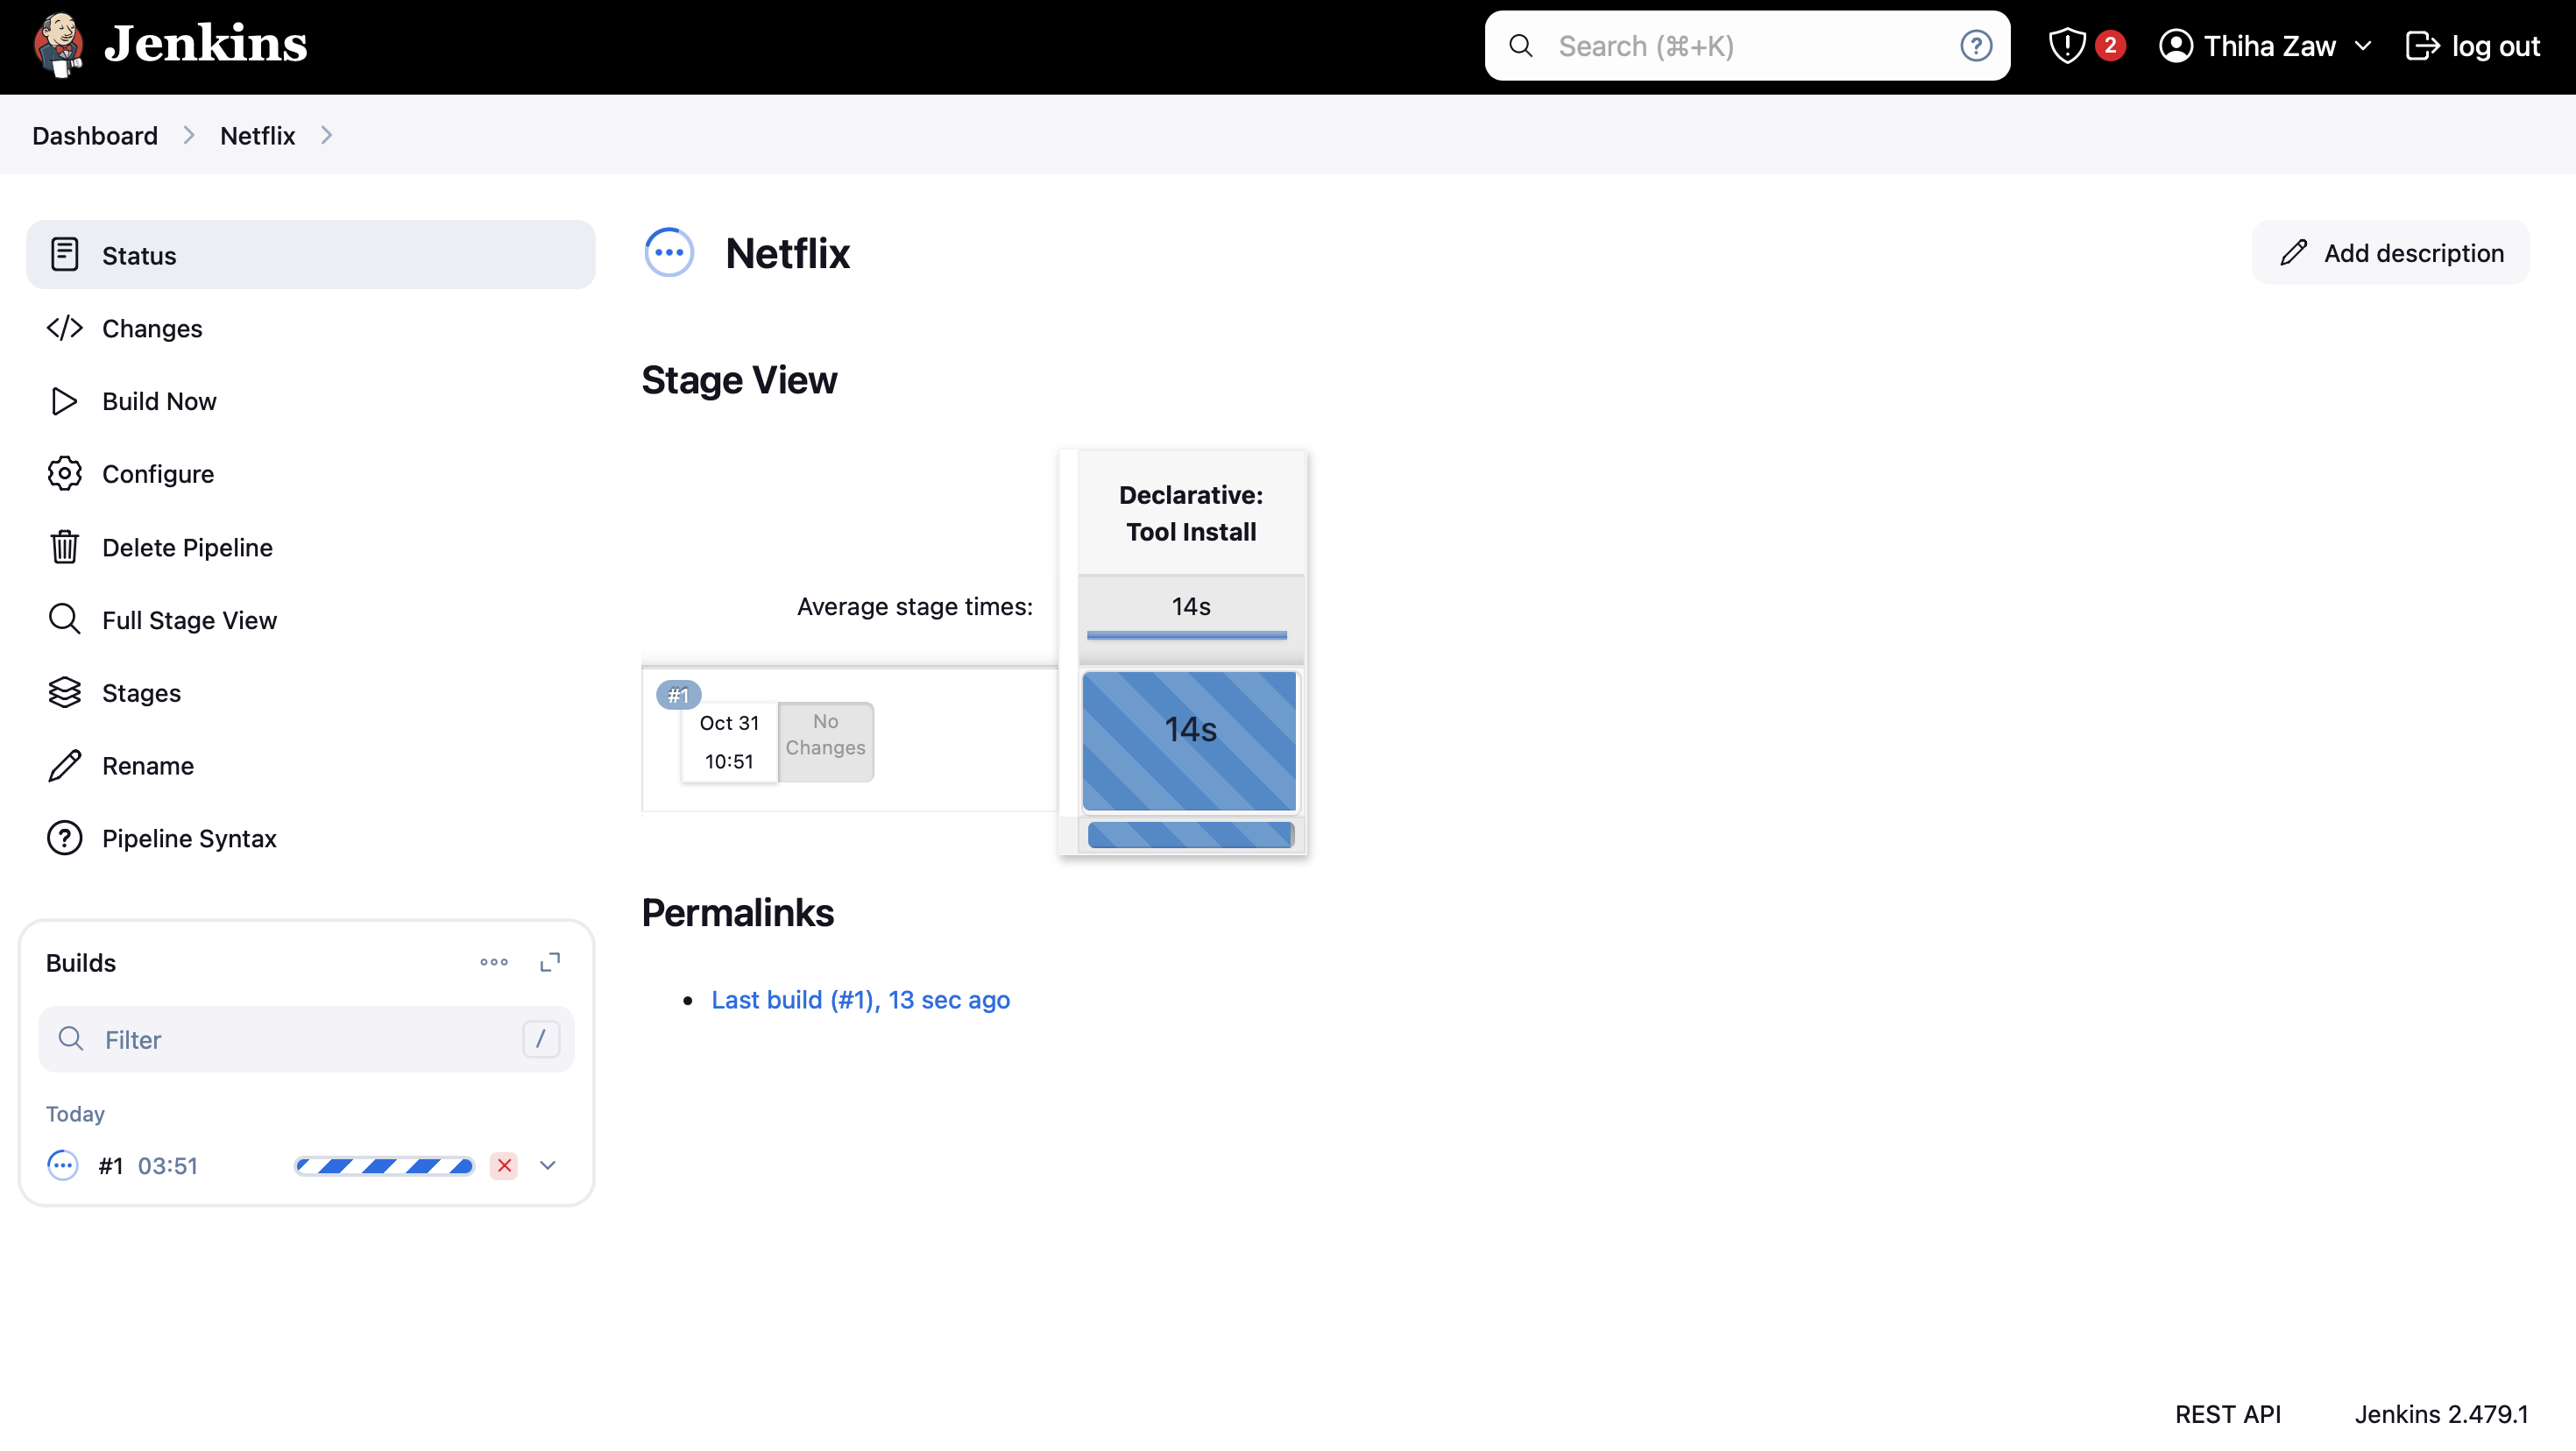
Remember to ensure that all necessary plugins (e.g., Docker, Kubernetes, SonarQube) are installed in Jenkins and properly configured before running the pipeline. Also, make sure that the required credentials (GitHub, Docker Hub, Kubernetes) are set up in Jenkins' credential store.
Possible Errors
NOTE: First time failed, because i didn’t set any permission on the folder we need to give permission to the workspace. So that Jenkins agents will be able to run.
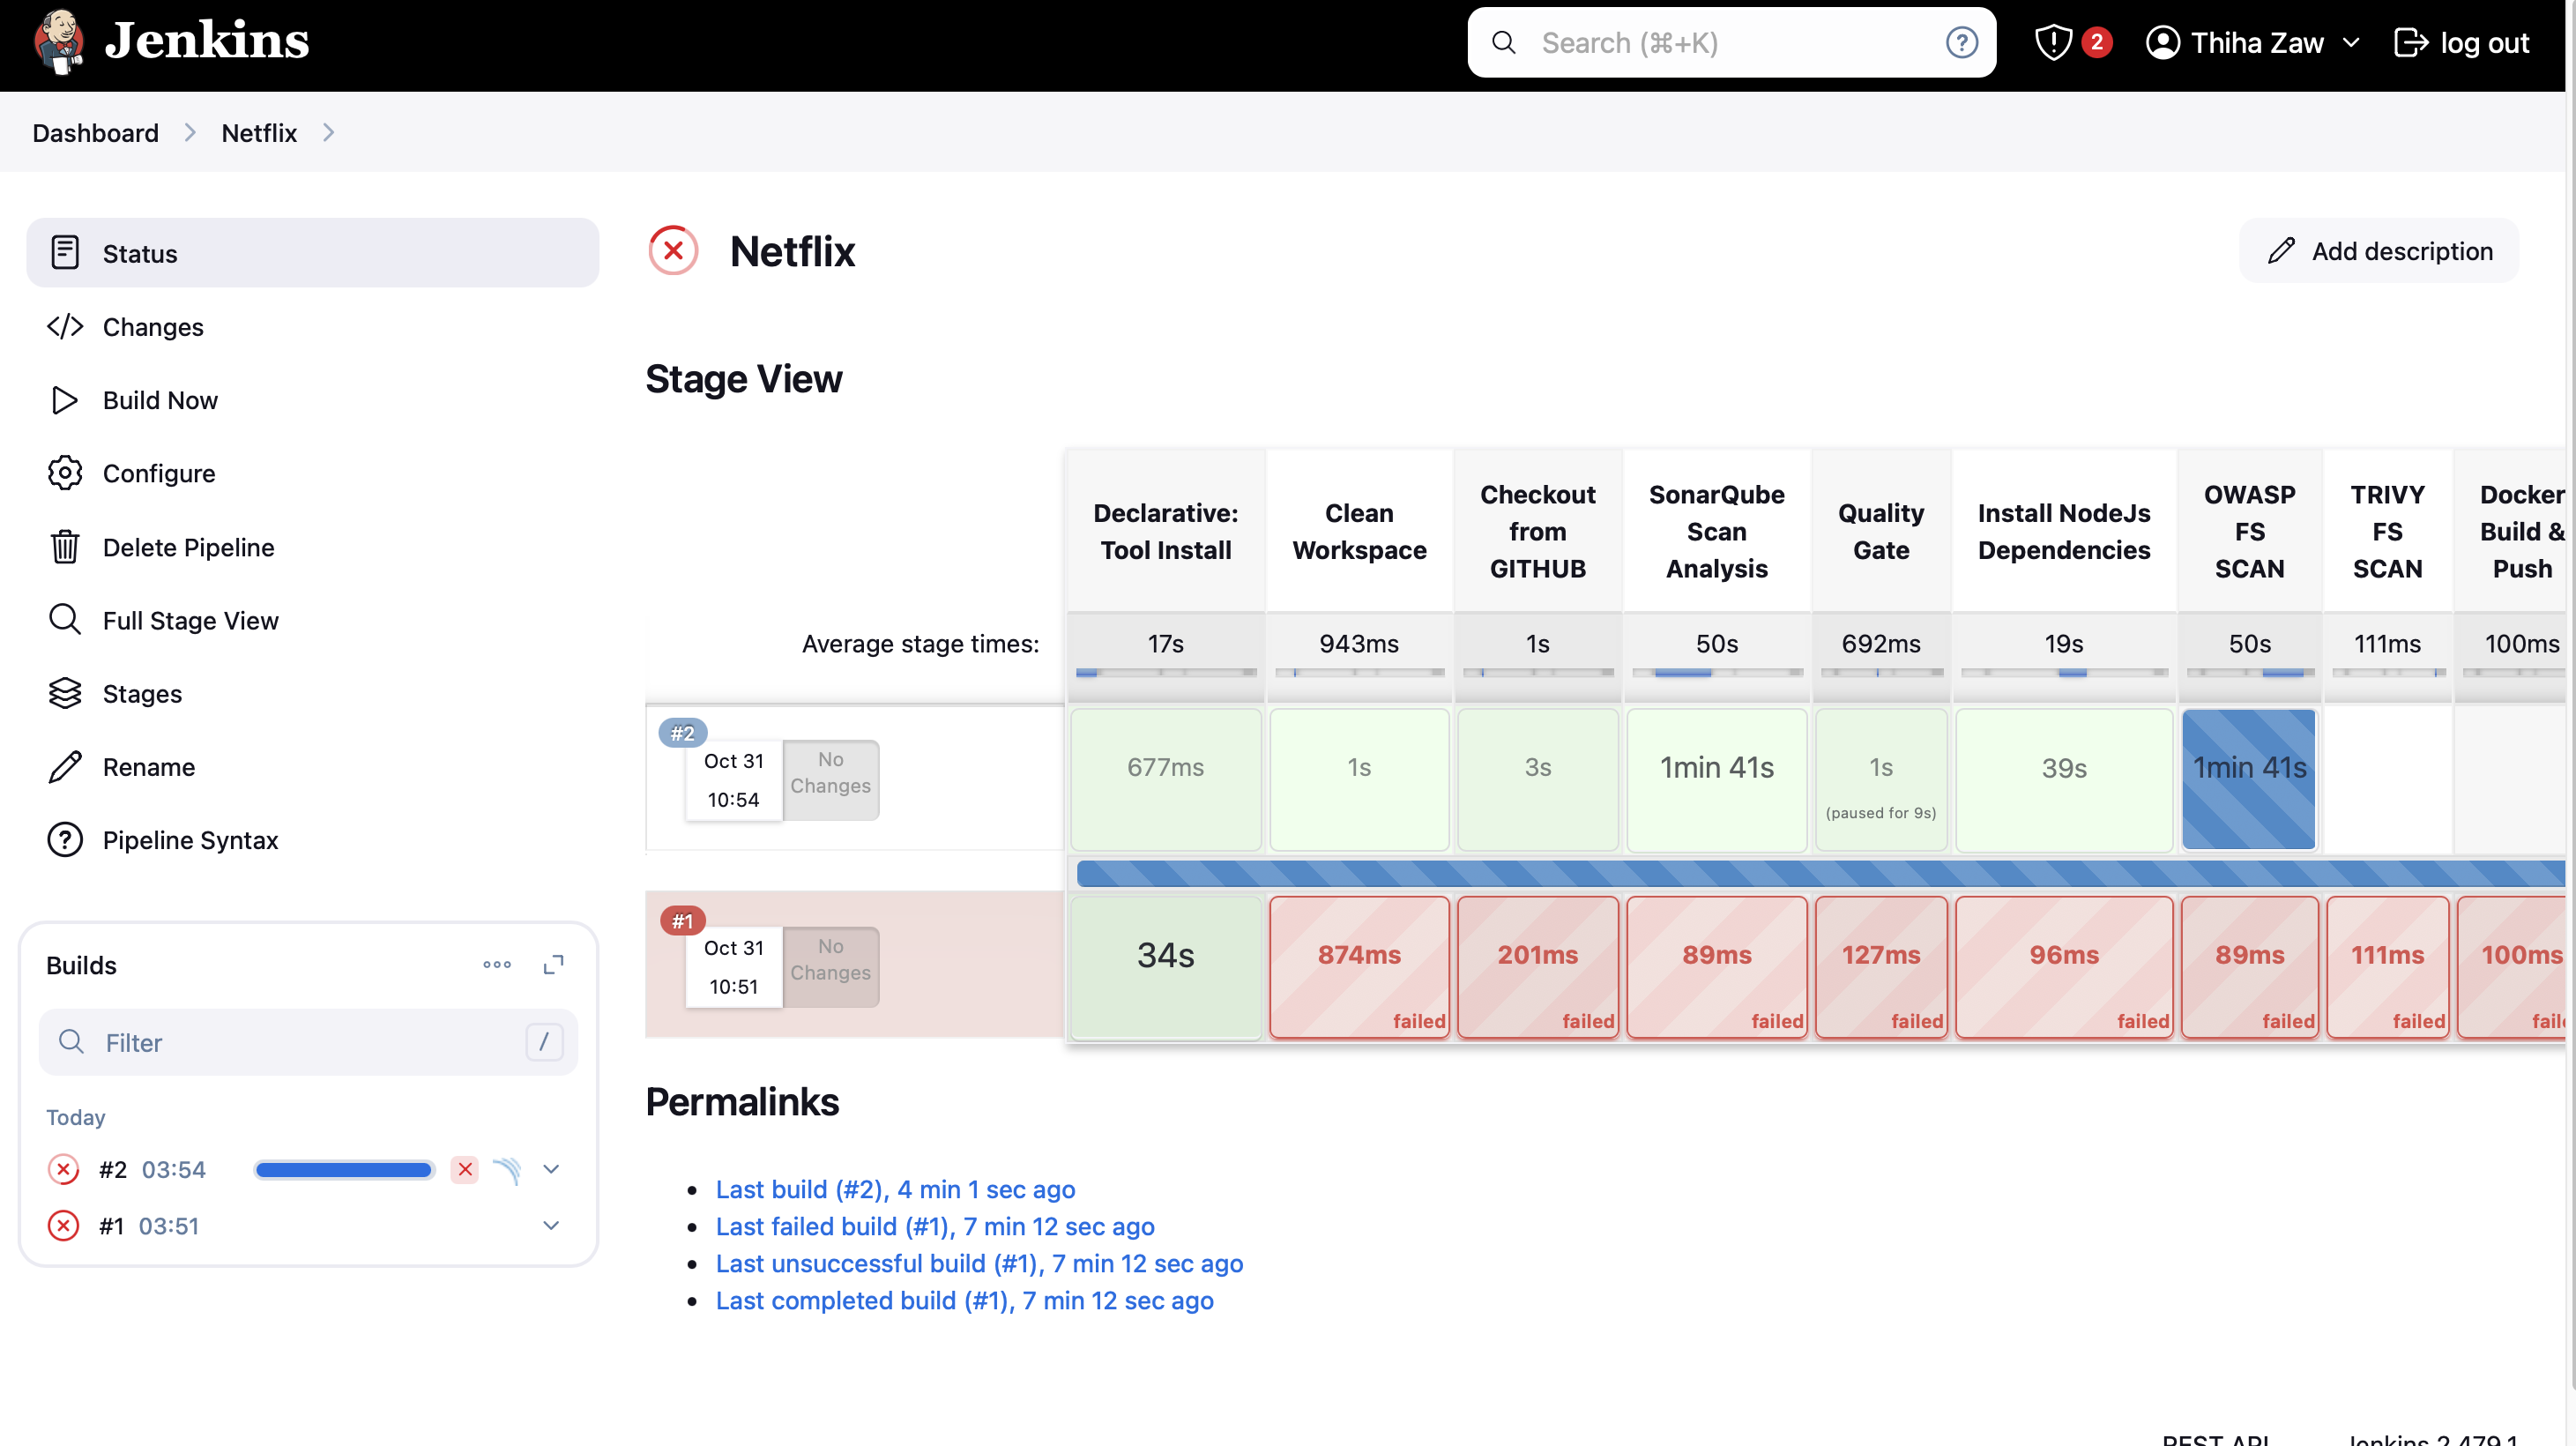
Permission Error
If you find the same error, ssh into the Jenkins Server, then
sudo chown -R jenkins:jenkins /var/lib/jenkins/workspace
sudo chmod -R 755 /var/lib/jenkins/workspace
ls -ld /var/lib/jenkins/workspace/
sudo systemctl restart jenkins
Variable Errors
It's important to note that we must carefully define variable names in our pipeline. Sometimes, we might make mistakes when copying names and variables. Please be vigilant about these types of errors to ensure smooth pipeline execution.
Kubernetes Deployment Error
It may happen for building up bare metal kubernetes setup. If you want to use Azure Kubernetes Service, you can use this terraform folder. “terraform_provision_aks”
NOTE: Ensure you modify the values specified in the Terraform configuration to match your requirements.

As soon as you get the cluster config, make secret.txt and add it into the Jenkins Credentials as shown in Step 22.
NOTE: When using Terraform deployment on Azure Kubernetes Service (AKS), we don't need to install Prometheus and Node Exporter manually. Since Azure manages the Kubernetes infrastructure, we can skip the manual setup of Kubernetes infrastructure using Kubeadm and LoadBalancer.
Step 26: Complete CICD Pipeline for Jenkins
The Complete CICD Pipeline for Jenkins is a comprehensive set of stages that automate the process of building, testing, and deploying the Netflix replica application.
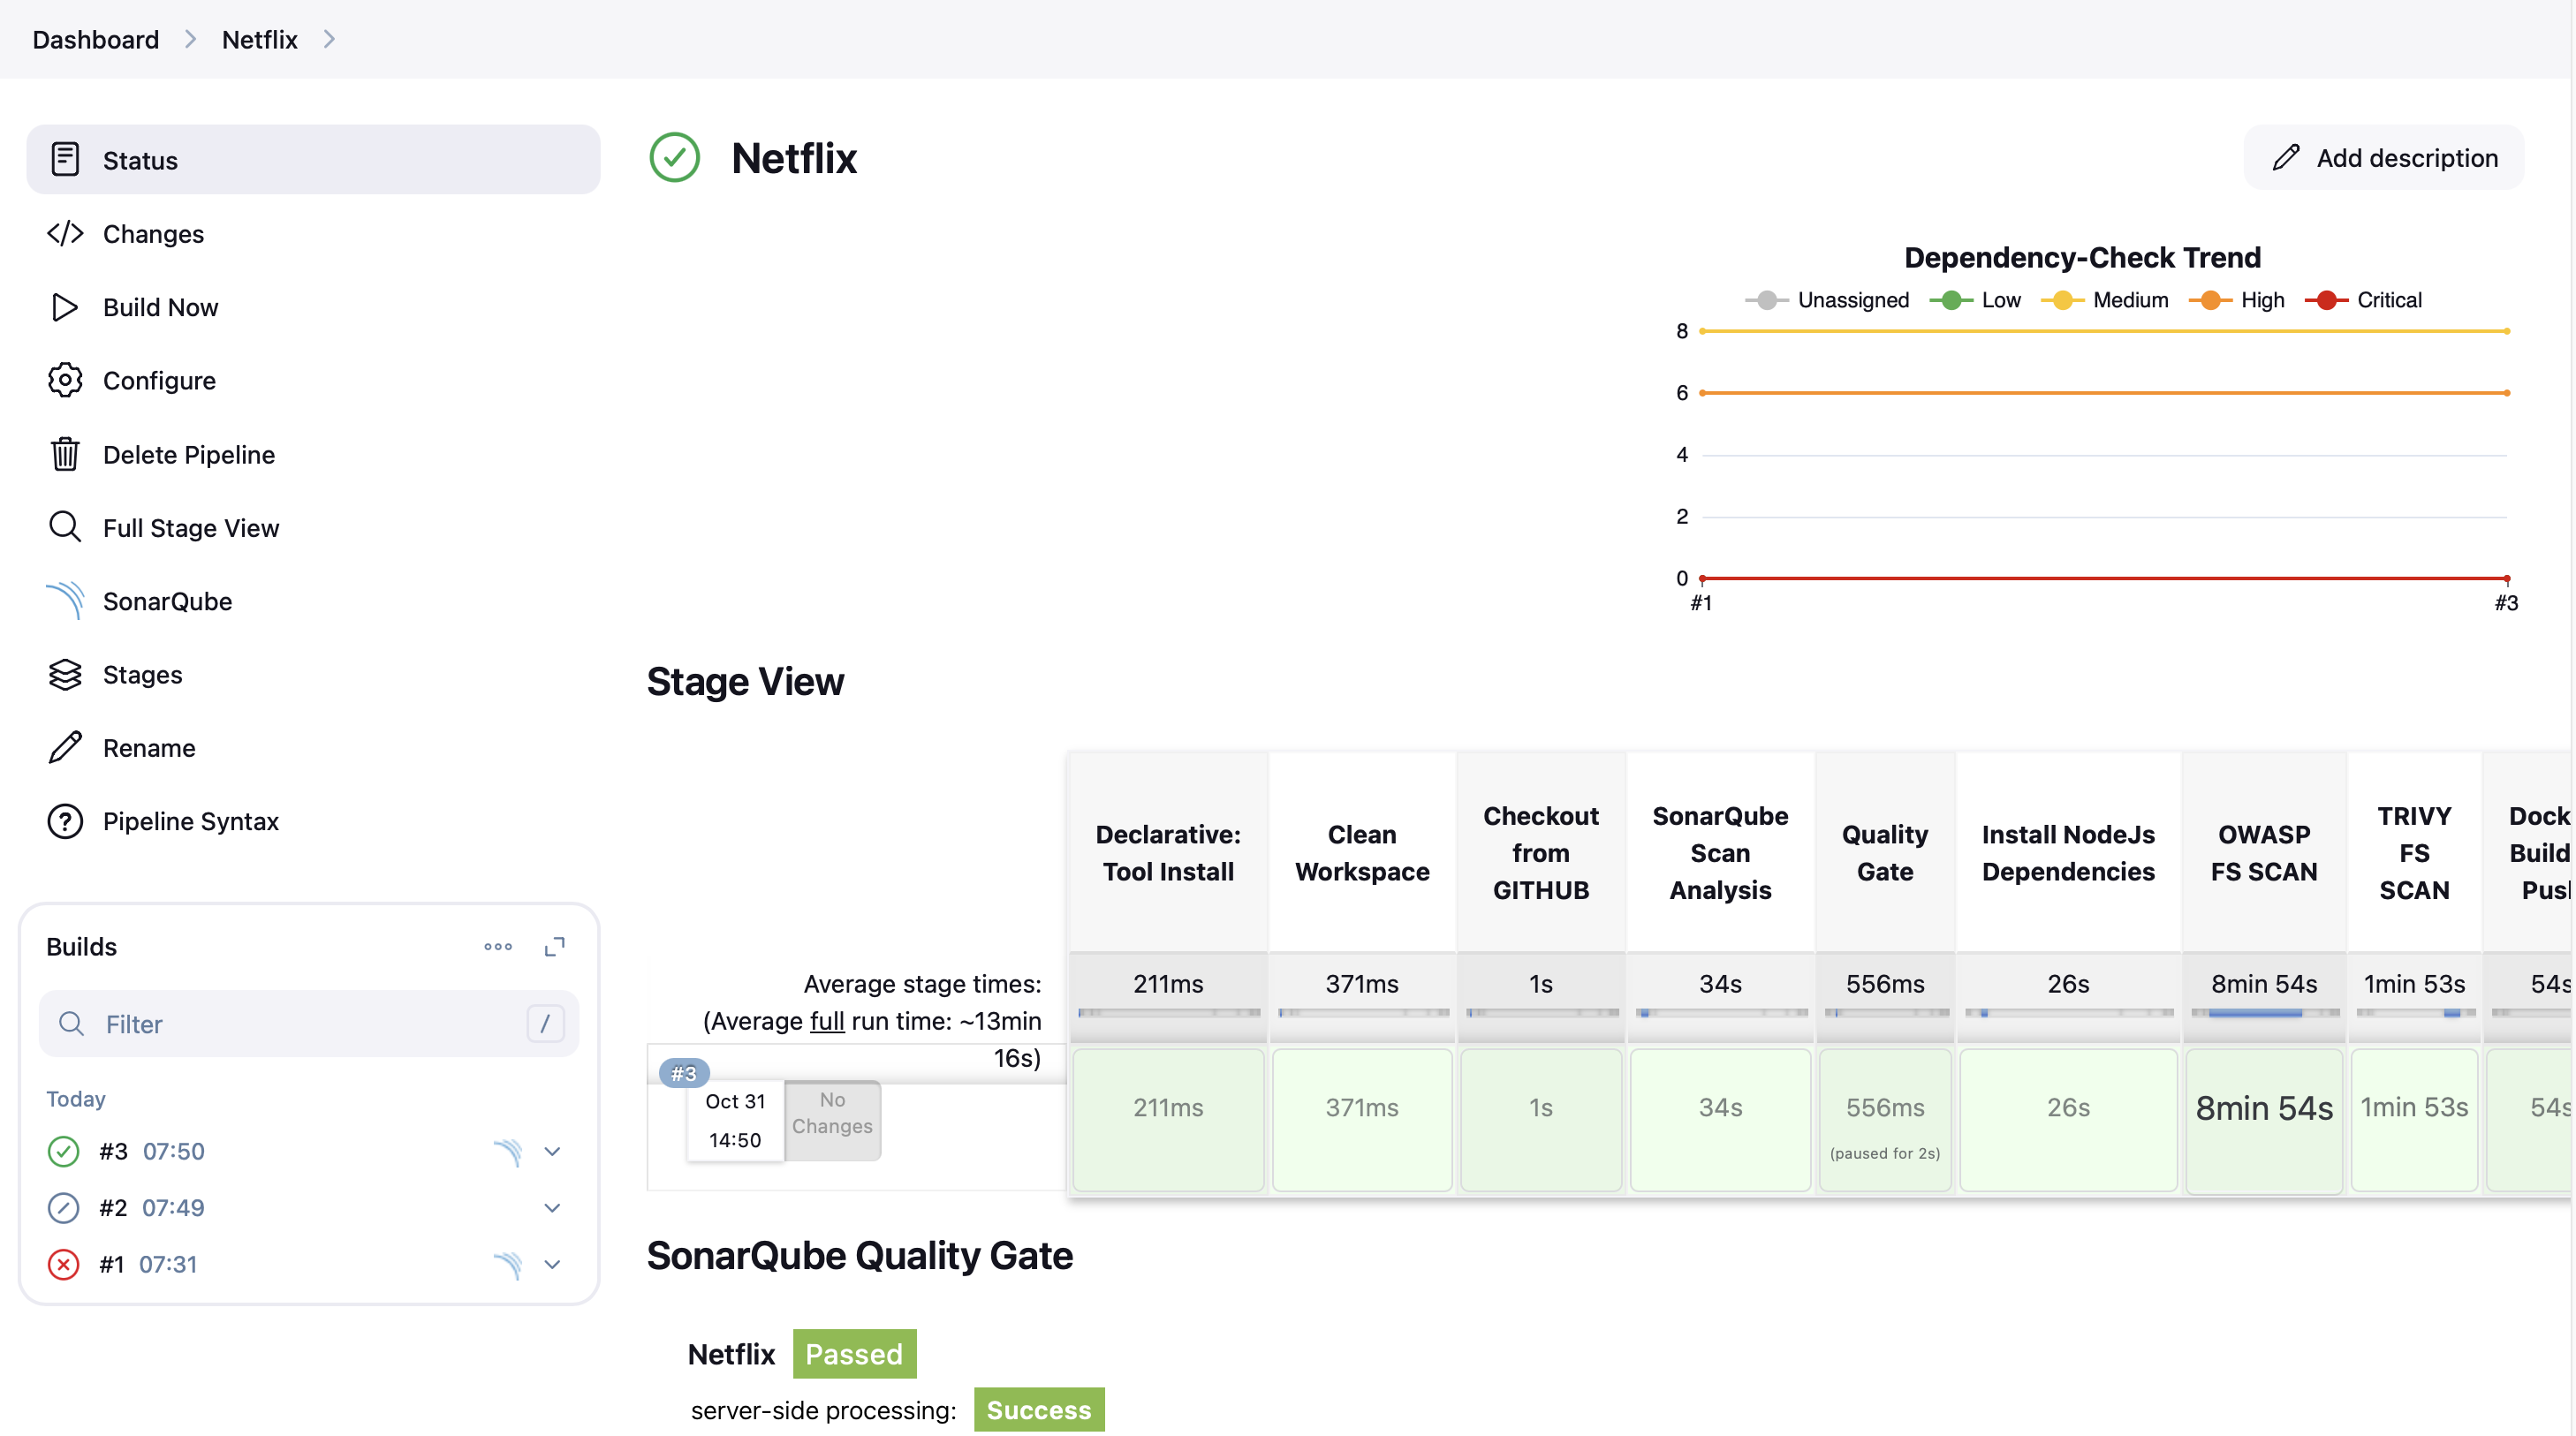
Summary
Here's a summary of the key stages in this pipeline:
- Workspace Cleanup and Code Checkout
- SonarQube Analysis for code quality
- Quality Gate check
- Node.js Dependencies Installation
- OWASP Dependency Check for security vulnerabilities
- Trivy File System Scan for additional security checks
- Docker Build and Push to registry
- Trivy Image Scan for container security
- Deployment to a Docker container
- Deployment to Kubernetes cluster
The pipeline also includes post-build actions to send email notifications with logs and scan reports. This comprehensive pipeline ensures code quality, security, and smooth deployment of the application across different environments.
pipeline {
    agent any

    tools {
        jdk 'jdk17'
        nodejs 'node16'
    }

    environment {

        SCANNER_HOME= tool 'sonar-scanner'
    }

    stages {
        stage('Clean Workspace') {
            steps {
                cleanWs()
            }
        }

        stage('Checkout from GITHUB') {
            steps {
                git branch: 'main', url: 'https://github.com/TechThiha/Netflix.git', credentialsId: 'github'
            }
        }

        stage('SonarQube Scan Analysis') {
            steps {
                withSonarQubeEnv('sonar-server') {
                    sh ''' $SCANNER_HOME/bin/sonar-scanner -Dsonar.projectName=Netflix \
                    -Dsonar.projectKey=Netflix '''
                }
           }
        }

        stage('Quality Gate') {
            steps {
                waitForQualityGate abortPipeline: false, credentialsId: 'Sonar-token'
            }
        }

        stage('Install NodeJs Dependencies') {
            steps {
                sh 'npm install'
            }
        }

        stage('OWASP FS SCAN') {
            steps {
                dependencyCheck additionalArguments: """
                  -o "./"
                  -s "./"
                  -f "ALL"
                  --prettyPrint
                """, odcInstallation: 'DP-Check'
                dependencyCheckPublisher pattern: 'dependency-check-report.xml'
            }
        }

        stage('TRIVY FS SCAN') {
            steps {
                sh "trivy fs . > trivyfs.txt"
            }
        }

        stage("Docker Build & Push"){
            steps{
                script{
                    withCredentials([usernamePassword(credentialsId: 'ecr-credentials', usernameVariable: 'AWS_ACCESS_KEY_ID', passwordVariable: 'AWS_SECRET_ACCESS_KEY')]) {
                       sh "aws ecr-public get-login-password --region us-east-1 | docker login --username AWS --password-stdin public.ecr.aws/s3e1v8a7"
                       sh "docker build --build-arg TMDB_V3_API_KEY=8bbb70a96fc606461acd71f172703286 -t netflix ."
                       sh "docker tag netflix:latest public.ecr.aws/s3e1v8a7/henops/netflix:latest"
                       sh "docker push public.ecr.aws/s3e1v8a7/henops/netflix:latest"
                    }
                }
            }
        }

        stage("TRIVY Docker Image Scan"){
            steps{
                sh "trivy image techrepos/netflix:latest > trivyimage.txt"
            }
        }

        stage("TRIVY ECR Image Scan"){
            steps{
                sh "trivy image public.ecr.aws/s3e1v8a7/henops/netflix:latest > trivyimage2.txt"
            }
        }

        stage('Deploy to container'){
            steps{
                sh 'docker rm -f netflix || true'
                sh 'docker pull public.ecr.aws/s3e1v8a7/henops/netflix:latest'
                sh 'docker run -d --name netflix -p 8079:80 public.ecr.aws/s3e1v8a7/henops/netflix:latest'
            }
        }

        stage('Deploy to kubernetes'){
            steps{
                script{
                    dir('Kubernetes') {
                        withKubeConfig(caCertificate: '', clusterName: '', contextName: '', credentialsId: 'k8s', namespace: '', restrictKubeConfigAccess: false, serverUrl: '') {
                                sh 'kubectl apply -f deployment.yml'
                                sh 'kubectl apply -f service.yml'
                        }
                    }
                }
            }
        }
    }

    post {
    always {
        emailext attachLog: true,
            subject: "'${currentBuild.result}: Build #${env.BUILD_NUMBER} for ${env.JOB_NAME}'",
            body: """
                <h2>Build Notification</h2>
                <p><strong>Project:</strong> ${env.JOB_NAME}</p>
                <p><strong>Build Number:</strong> ${env.BUILD_NUMBER}</p>
                <p><strong>Status:</strong> ${currentBuild.result}</p>
                <p><strong>Build URL:</strong> <a href="${env.BUILD_URL}">${env.BUILD_URL}</a></p>
                <p>For more details, please check the attached logs.</p>
            """,
            to: '[email protected]',
            attachmentsPattern: 'trivyfs.txt,trivyimage.txt,trivyimage2.txt'
        }
    }
}
After the deployment, check the services to find the External-IP. Copy and paste this IP address into your browser to access the application.

You'll see the External-IP displayed as shown above. Use this to access the application in your browser.
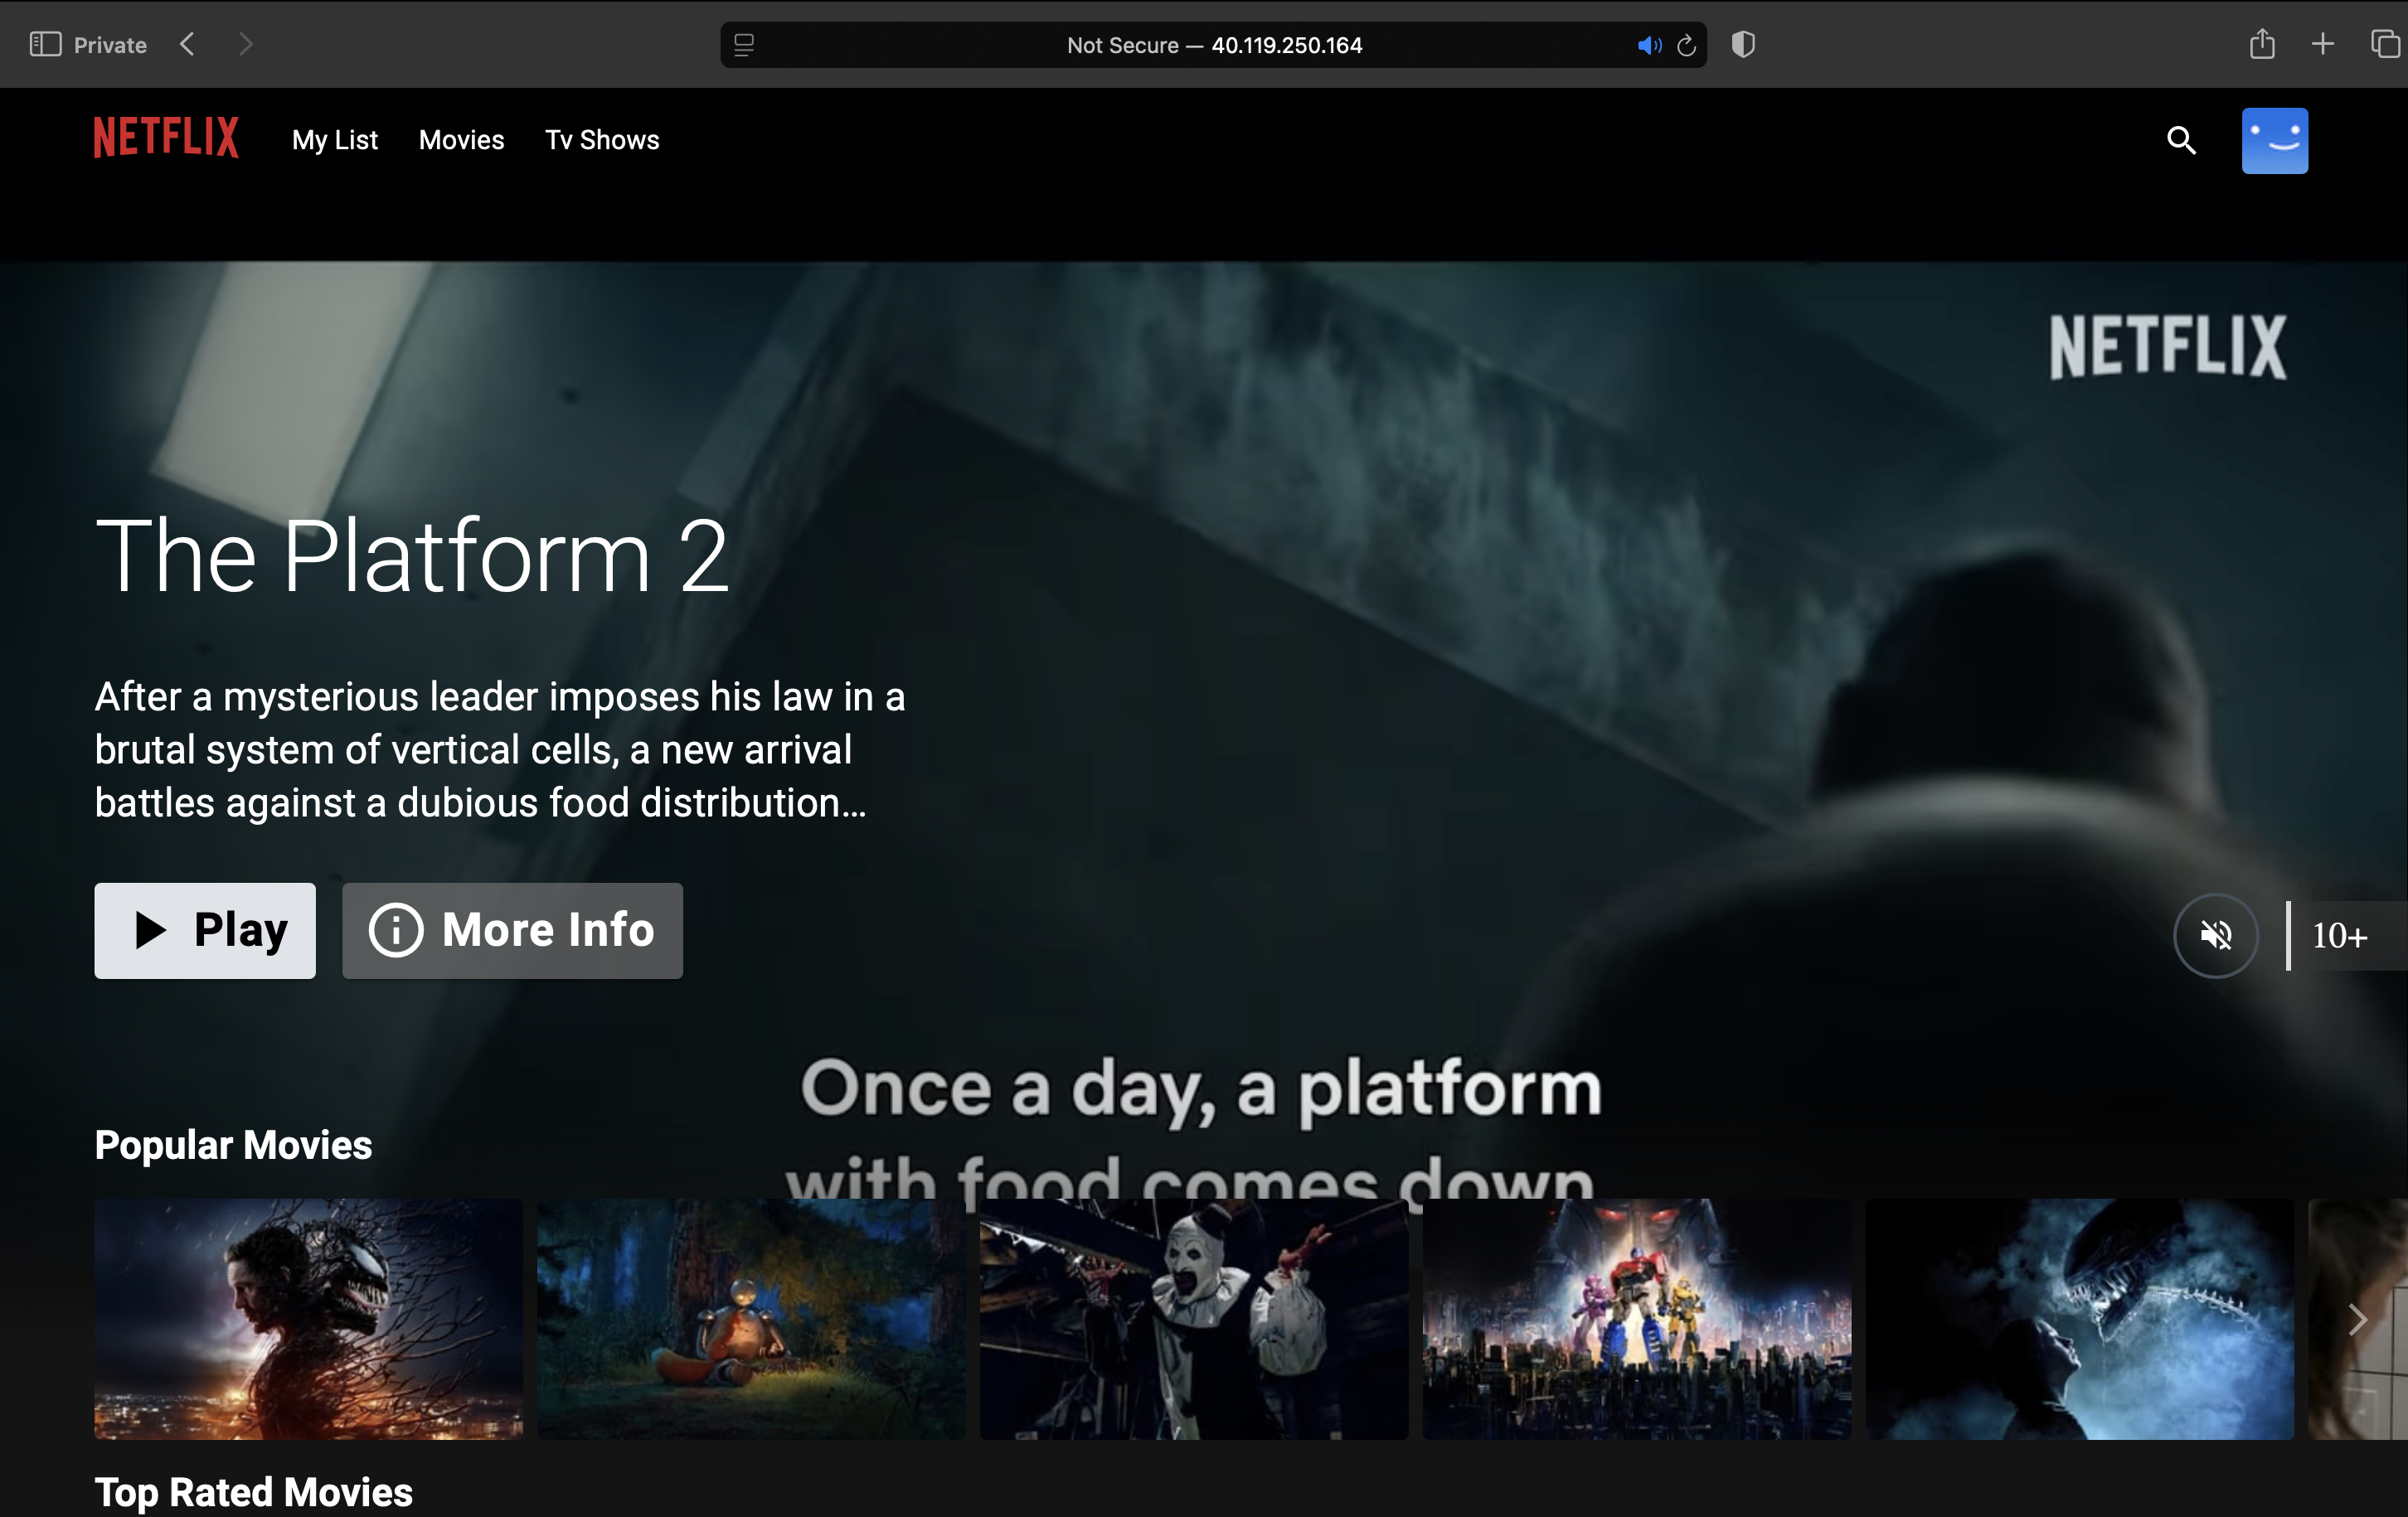
Once the application loads, you can click the Play button to watch a movie. As I didn't develop this code myself, I won't be making any modifications or fixes to it. However, if you encounter any issues while following these implementation steps, please don't hesitate to reach out to me for assistance.
Further Improvement
Based on the existing Jenkins pipeline, here are some additional steps we could consider adding to enhance the CI/CD process:
- Unit Testing: Add a stage to run unit tests for the application. This could be done using a testing framework appropriate for the project, such as Jest for JavaScript.
- Integration Testing: Include a stage for running integration tests to ensure different components of the application work together correctly.
- Performance Testing: Implement a stage for performance testing to ensure the application meets performance benchmarks.
- Code Coverage: Add a step to generate and publish code coverage reports, which can be integrated with the SonarQube analysis.
- Artifact Archiving: Include a stage to archive build artifacts for future reference or deployment.
- Automated Rollback: Implement a mechanism for automated rollback in case the deployment fails or causes issues in production.
- Slack Notifications: Add Slack notifications at various stages of the pipeline to keep the team informed about the build and deployment status.
- Environment-specific Deployments: Extend the deployment stages to handle different environments (e.g., staging, UAT) before the production deployment.
- Manual Approval: For critical stages like production deployment, add a manual approval step to ensure human oversight.
These additions would further enhance the robustness and reliability of the CI/CD pipeline for the Netflix replica application.
This project was created by HenOps but Special Thanks to Kwasi Twum-Ampofo (KTA) and Jason for generously sharing the code. Your contributions to this project are greatly appreciated! It showcases various DevOps practices including automated testing, security scanning, containerization, and deployment to Kubernetes. The pipeline ensures code quality, identifies vulnerabilities, and streamlines the deployment process, making it an excellent example of modern software development and operations practices.